| Issue |
A&A
Volume 700, August 2025
|
|
|---|---|---|
| Article Number | L23 | |
| Number of page(s) | 11 | |
| Section | Letters to the Editor | |
| DOI | https://doi.org/10.1051/0004-6361/202553995 | |
| Published online | 20 August 2025 | |
Letter to the Editor
Ancient, eclipsing, tidally locked: A blue lurker progenitor in the population of extreme-velocity star candidates
1
Institut für Physik und Astronomie, Universität Potsdam, Haus 28, Karl-Liebknecht-Str. 24/25, 14476 Potsdam, Germany
2
Dr. Karl Remeis-Observatory & ECAP, Astronomical Institute, Friedrich-Alexander University Erlangen-Nuremberg, Sternwartstr. 7, 96049 Bamberg, Germany
3
Instituto de Física y Astronomía, Universidad de Valparaíso, Gran Bretaña 1111, Playa Ancha, Valparaíso 2360102, Chile
⋆ Corresponding author: This email address is being protected from spambots. You need JavaScript enabled to view it.
Received:
1
February
2025
Accepted:
22
July
2025
Abstract
Many extreme velocity candidate stars have been found based on Gaia astrometry, but need spectroscopic confirmation. We selected late-type hypervelocity star (HVS) candidates from the Gaia DR3 catalogue with a 1σ lower limit of the tangential velocity of 800 km s−1. J1903-0023, one of the brightest targets, stands out as a high-priority candidate for follow-up spectroscopy using the X-shooter instrument at ESO-VLT. We determined its atmospheric parameters and abundances utilising synthetic spectral grids and a global χ2-minimisation procedure, and its stellar parameters with the help of evolutionary tracks and the spectral energy distribution. The star shows variability in its light curve, and follow-up spectroscopy confirms that the star is radial-velocity variable. The spectroscopic distance of J1903-0023 is lower than that based on the parallax, indicating that the star is not a hypervelocity binary star, but is bound to the Galaxy. The star turned out to be of spectral type F, very similar to the extreme-velocity star J0725-2351, which we analysed in the same way as the target. Apparently, both are very metal-poor and old halo main-sequence (sdF) stars with masses slightly below the halo turn-off mass, and they both show low metallicity ([Fe/H] = −2.3, −2.6) and strong alpha enhancement ([α/Fe]∼0.44). J0725-2351 is non-rotating (v sin i < 3 km s−1); instead, J1903-0023 is a fast rotator (v sin i = 42.3 ± 2.0 km s−1). The Gaia and ZTF light curves show an eclipse at a 1.179-day period, similar to the rotation period of J1903-0023. We therefore conclude that J1903-0023 is a high-velocity tidally synchronised binary, most likely with a metal-poor M-dwarf companion.
Key words: blue stragglers / stars: kinematics and dynamics / stars: late-type / stars: Population II
© The Authors 2025
 Open Access article, published by EDP Sciences, under the terms of the Creative Commons Attribution License (https://creativecommons.org/licenses/by/4.0), which permits unrestricted use, distribution, and reproduction in any medium, provided the original work is properly cited.
This article is published in open access under the Subscribe to Open model. This email address is being protected from spambots. You need JavaScript enabled to view it. to support open access publication.
1. Introduction
Old extreme-velocity halo stars that are tracers of the history of Galactic formation are now being discovered by combining large spectroscopic surveys with Gaia astrometry (Li et al. 2023). Many such stars were originally candidate hypervelocity stars (HVSs) unbound from the Galaxy, whose ejection mechanisms are still unclear, but they turned out to be bound when precise astrometry from Gaia became available (Wojtkowska & Poleski 2024; Boubert et al. 2018). The lack of radial velocity measurements calls for follow-up spectroscopy. For example, Hawkins & Wyse (2018), Reggiani et al. (2022), and Nelson et al. (2024) have studied a total of 36 late-type HVS candidates, which allowed them to find elemental abundances and study the formation scenarios of such stars. These scenarios include, but are not exclusive to, accretion from satellite galaxies, in situ formation through dynamic heating, and ejections from the disc. Stars formed through these mechanisms may have similar kinematic properties. Precise studies of spectra to characterise the metallicity and individual abundances of the stars provide the valuable information used to constrain the nature of the stars.
In this letter we report the identification of the candidate HVS Gaia DR3 4265540383431508736 (hereafter J1903-0023), as a tidally synchronised binary in the halo. The system will undergo mass-transfer soon, and can be characterised as a pre-blue lurker system. The term blue lurker has been coined for stars that are the lower-mass counterparts of blue stragglers. They show higher rotation rates than main-sequence stars of the same mass and appear to be younger than their predicted age estimates in clusters (Leiner et al. 2019). The overall binary fraction as well as the tight binary fraction of metal-poor stars are highly debated topics. Latham et al. (2002) found that the observed fraction of binaries was roughly similar in the disc and the halo. Recent studies show that the close binary fraction is likely anti-correlated with metallicity (Moe et al. 2019). Bashi et al. (2024) also find a significant fraction of binaries in accreted and in situ halo stars.
The spectroscopic analysis (Section 3), light curves (Section 5), and spectral energy distribution (SED) (Section 6) of the star suggest that it is a metal-poor F-type star, most likely with an M-dwarf companion. We also analysed one of the X-shooter spectra of the extreme-velocity sdF-type star WISE J072543.88-235119.7 (hereafter J0725-2351), which was studied by Scholz et al. (2015). We use it as a twin comparison star to validate our results.
2. Target selection, and spectroscopic and photometric observations
We searched for fast stars using the same query to the Gaia DR3 catalogue (Gaia Collaboration 2023) as El-Badry et al. (2023), who used this method to identify several hypervelocity white dwarfs. To search for main-sequence stars, the colour criterion was extended to include GBP − GRP > 0.7 mag. Among all objects, J1903-0023 stands out as the only star with a tangential velocity high enough to indicate HVS kinematics. The star has a parallax of 0.40 ± 0.06 mas, making it one of the closest known HVS candidates. The high proper motion of the star translates into a galactocentric tangential velocity of ∼800 km s−1. The astrometric properties of J1903-0023 were investigated by Scholz (2024), who applied relevant quality criteria to 72 stars whose Galactic transversal velocities exceed 700 km s−1. J1903-0023 passed all checks except for the nearest-neighbour criterion because it is located in a crowded field in the Galactic plane where parallax uncertainty might be up to four times larger (Scholz 2024). J1903-0023 is in the top ten of the highest-priority extreme velocity stars and is among the brightest (G = 16.5 mag).
We combined photometric magnitudes to construct the SED and fitted it with synthetic models, as described in Heber et al. (2018), to get an estimate of the angular diameter, reddening, and stellar temperature. The SED had no IR excess, and suggested a highly reddened F-type star (see Fig. C.2). Combining the Gaia parallax with the angular diameter, we calculated a radius of 1.5 ± 0.2 R⊙ corresponding to a mass of ∼1.7 M⊙, for a log g ∼ 4.5. A precise measurement of the atmospheric parameters, metallicity, and radial velocity was required to probe further. The star was later reported to be variable in Gaia Collaboration (2023), although with only a few data points.
We obtained optical spectra at the ESO VLT with the X-shooter instrument at a high signal-to-noise ratio (S/N > 60) in the blue and VIS arms of X-shooter (λ = 3000 − 9000 Å at a resolving power range of R = 5500 to 11 500). Due to the light curve variability in the Zwicky Transient Facility (ZTF) light curve, two low S/N, low-resolution spectra were obtained to check for radial velocity (RV) variability from the Nordic Optical Telescope (NOT/ALFOSC)1 and Southern Astrophysical Research (SOAR/Goodman)2 spectrographs covering the optical range from approximately 3600 Å to 5200 Å. Using a 1″ slit, each set-up achieves a spectral resolution of 2.2 Å, and 2.6 Å, respectively, corresponding to RV precisions between 10 and 15 km s−1. For J0725-2351 we reanalysed an archival X-Shooter spectrum (R = 6655 in the blue arm, and R = 8935 in the VIS arm) of high S/N (165 in the blue, 178 in the VIS).
3. Spectroscopic analysis
We used the model grids from the ATLAS12 and SYNTHE codes (Kurucz 1996), which assume local thermodynamic equilibrium (LTE) to compute synthetic spectra. The extended model grids cover a metallicity range [Fe/H] of −3 to 0.5 and an alpha enhancement [α/Fe] of 0 to 0.45. After removing the cosmics and data reduction artefacts, the entire spectrum was fit using a global χ2-minimisation routine, similar to that described in Irrgang et al. (2014). We simultaneously fit the log g, Teff, the ratios [Fe/H] and [α/Fe], the projected rotational velocity v sin i, and the radial velocity of the star. Poorly modelled spectral regions were removed from the fit.
The spectral fits are shown in Figs. A.1 and A.1. The stars have very similar Teff, log g, metallicities, and alpha enhancements (Table 1). J0725-2351 is known to be very metal poor (Scholz et al. 2015), and we derive [Fe/H]=−2.33 ± 0.10 with strong alpha enhancement ([α/Fe] = 0.44 ± 0.05). J1903-0023 is even more metal poor at [Fe/H] ≈ −2.63 with the same large alpha enhancement as J0725-2351, which implies that both stars are likely old and best classified as population II subdwarfs (sdFs). The most intriguing difference, however, is the projected rotational velocity. While J0725-2351 is non-rotating, as expected for an ancient halo star, J1903-0023 is rotating unusually fast at v sin i = 42 ± 2 km/s. To demonstrate the difference, Figure 1 compares the Mg I and Ca II triplets in the normalised spectra of J0725-2351 and J1903-0023; while the lines are sharp for J0725-2351, all the spectral lines of J1903-0023 are significantly broadened by rotation.
Best-fit parameters for X-shooter spectrum fitted using a χ2-minimisation method with statistical uncertainties.
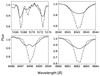 |
Fig. 1. Mg I and Ca II triplets in the normalised and RV-corrected spectra of J1903-0023 (solid) and J0725-2351 (dash-dotted). The rotational velocity broadening can be clearly seen for J1903-0023. The resolving power is 6655 for the blue arm and 8935 for the VIS arm for J0725-2351, and the spectrum of J1903-0023 was convolved to match it. |
The very low metallicity is at odds with our previous assumption of the SED-based classification because its radius must be much smaller, and therefore the star is closer than indicated by the Gaia parallax. This leads us to believe that the Gaia parallax is underestimated and cannot be used to derive a reliable stellar radius and mass. Further analysis of spectra from NOT/ALFOSC and SOAR/Goodman for J1903-0023 was done by fitting the same model with the atmospheric parameters fixed to the X-shooter fit. An RV shift of −80 km s−1 was found for both spectra, consistent with the Gaia classification as an eclipsing binary (see Appendix A).
4. Stellar masses and ages from evolutionary tracks
We derived estimates of the masses and ages for the stars based on MIST evolutionary tracks (Dotter 2016; Choi et al. 2016; Paxton et al. 2011, 2013, 2015) for metallicities [Fe/H] −2, −2.5, and −3.0. Utilising a Bayesian Markov chain Monte Carlo (MCMC) approach, we put priors on the mass (less than 1.6 M⊙, i.e. twice the halo turn-off mass), age (less than 14 Gyr), and metallicity (Gaussian, centred at our observed metallicity) and we interpolated to sample near the log g and Teff we derived from the spectra. We used the SciPy package (Virtanen et al. 2020) along with the Emcee package (Foreman-Mackey et al. 2013) for this purpose. This allowed us to get the posterior distributions of log g, Teff, age, and metallicity. For the case of J0725-2351 we find a median mass of  M⊙ and an age of
  . The stellar mass is lower than Scholz et al. (2015), due to a higher log g derived from the new model grid. The mass derived from the tracks shown in Fig. B.1 is in agreement with the spectrophotometric mass derived using Gaia parallax.
We repeated the procedure for our new sdF star to see if a single star solution exists for it. We found no conclusive parameters for this star. Figure B.2 shows that the derived parameters are inconsistent with evolutionary tracks for ages younger than 14 Gyr at 1σ confidence level. Models with rotation ∼0.4 Vc, corresponding to ∼140 km s−1 for a 0.8 M⊙ star do not change the results. Within 2σ uncertainty the star may be young (< 1 Gyr) with a mass of 0.75 M⊙, or old (∼13 Gyr) with a mass of 0.72 M⊙. The younger age is highly unlikely for a halo star, and is possibly due to the large uncertainty on the log g. The final adopted parameters of the two stars are given in Table 3.
5. Light curve analysis
J1903-0023 was reported by Gaia to be an eclipsing binary star with a period of 1.179 days (Gaia Collaboration 2022b), although the light curve is quite noisy and has many period peaks. However, the star also has a ZTF light curve (Bellm et al. 2019; Masci et al. 2019), which allowed us to constrain its binary parameters. Since no flux from the secondary is detected in the SED and no secondary eclipses can be discerned in the light curve, the companion must have low luminosity. Using the inverse modelling described by Conroy et al. (2020), we were able to model the g-band light curve with a primary with the spectrophotometric Teff and radius (see Table 3), and a secondary component with 3940 K and radius of 0.46 R⊙ in PHOEBE (Prša & Zwitter 2005; Prša et al. 2016; Conroy et al. 2020), and we conclude that this is the most likely architecture of the binary. Spectroscopic and photometric follow-up is needed to resolve the system. The phase-folded observed light curve and the model are shown in Fig. 2. The parameters were then sampled using the EMCEE package (Foreman-Mackey et al. 2013) with a Gaussian prior on the secondary radius centred at 0.5 R⊙ (see Table 2 and Appendix D).
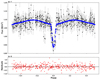 |
Fig. 2. ZTF LC phase-folded with a period of 1.179 days. The blue line is the PHOEBE model. |
Median light curve parameters with 1σ uncertainties.
6. Radii, luminosities, and distances
We repeated the SED analysis of J1903-0023 and J0725-2351 described in Sect. 2, but used the spectroscopic values of Teff, [Fe/H], and log g, with the same model grids as in the spectral analysis to obtain their angular diameters and line-of-sight reddening. The resulting best-fit models are compared to the observed SEDs in Figs. C.2 and C.3, and the corresponding values are listed in Table 3. The models match the observations very well. There is no hint of the presence of a cool companion that might show up in the IR. An M dwarf with a temperature of 3560 K would contribute < 1.7% to the luminosity, and is therefore hard to detect in the SED.
Spectrophotometric parameters for the two stars.
J1903-0023 is highly reddened with a colour excess E(44-55) of 0.547 ± 0.012 mag because of its location in the Galactic disc (b = −2.8°). J0725-2351 lies in the disc (b = −3.6°), but its reddening is low because it is much closer. The high reddening is visible in the spectrum of J1903-0023 in the form of diffuse interstellar band features at 4430, 6177, 6284, 6614, 8620 Å (see Fig. A.1). The stellar masses were derived by comparing the atmospheric parameters to predictions from evolutionary tracks (see Sect. 4). Hence, we were able to derive the stellar radii from their masses and gravities and their distances from angular diameter and radius (see Table 3). Finally, the luminosities were derived from the effective temperatures and radii.
While the spectroscopic distance for J0725-2351 is consistent with the Gaia-based parallax, for J1903-0023 the former (dspectro = 1.45 ± 0.1 kpc) is significantly smaller than the latter ( kpc). This adds doubt as to the reliability of the Gaia parallax (see Scholz 2024), and results in a more moderate heliocentric tangential velocity of 585 ± 40 km/s−1 than the previous estimate (see also Sect. 7). This discrepancy is further evident in the difference in parallax from DR2 (0.19 mas) to DR3 (0.4 mas).
7. Kinematics
We calculated the trajectories from the spectroscopic distances, and the radial velocities as described in Irrgang et al. (2018, 2013). We use a revised version of the model introduced by Allen & Santillan (1991), called Model 1, for the Galactic potential and numerically integrated the equations of motion for the stars using a fourth-order Runge-Kutta solver. The local standard of rest (LSR) velocities (U, V, W)⊙ are (11.1 ± 1, 12.24 ± 2, 7.25 ± 0.5) km s−1, and are from Schönrich et al. (2010).
For J1903-0023 it is difficult to measure the radial velocity of the system since the three spectra for a binary with a 1.178-day period capture a small phase space. Using the ephemeris and period obtained from the light curve, we get a γ = −130 ± 40 km s−1 with a slightly inflated uncertainty to capture the uncertainty in the ephemeris and the RVs. Since the star’s tangential velocity component is the dominant one, the RV does not affect the kinematics significantly. Running multiple models with different radial velocities, the star can only be unbound if the systemic velocity is < − 600 km s−1 or > 250 km s−1. These velocities are highly unlikely since the maximum peak-to-peak velocity can only be close to ∼180 km s−1, thus making the star bound.
Both stars are on retrograde orbits, strengthening the conclusion that they belong to the halo population. The proper motion of J0725-2351 (268.11 ± 0.02 mas yr−1) is in agreement with that measured by Scholz et al. (2015, 266.7 ± 1.9 mas yr−1) derived from ground-based proper motions, but much more precise than the latter. However, because the parallax-based distance is smaller than the previously adopted value, its Galactic rest-frame velocity decreases from vgrf = 460 km s−1 to 240 km s−1. J1903-0023 is bound to the Galaxy, but is an extreme velocity object with the velocity vector lying at the edge of the 3σ contours of the halo in the Toomre diagram, as shown in Fig. 3.
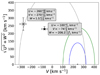 |
Fig. 3. Toomre diagram for J1903-0023 (cross) and J0725-2351 (star). The 3σ contours of the thin disc (blue), the thick disc (green), and the halo (grey) are constructed from the U, V, and W distributions of Anguiano et al. (2020). U is the velocity component towards the Galactic centre, V in the direction of Galactic rotation, and W perpendicular to the Galactic plane. |
The Galactic trajectories of the two stars are very different (see Fig. 4). The eccentric orbit ( ) of J0725-2351 is typical for halo stars as it extends to large distances in all coordinates, i.e. it is a halo star caught when passing through the Galactic plane, as suggested by Scholz et al. (2015). The orbit of J1903-0023 is even more eccentric (
 ) and extends far out in the plane to Rmax ∼ 19 kpc, but stays close to it over the entire integration time. The potential Galactic origins of the stars based on their different kinematics are discussed in the Appendix. We conjecture that J1903-0023 might be related to the Phlegethon stream or the Sequoia merger.
 |
Fig. 4. Galactic orbits for J1903-0023 (left panel) and J0725-2351 (right panel), in a Galactic Cartesian coordinate system with the z-axis pointing to the Galactic north pole, calculated back in time for 15 Gyr. The Galactic centre is marked with a plus sign, the location of the Sun at x = −8.33 ± 0.35 kpc is shown as an orange circle. J1903-0023 has a peculiar trajectory with no significant motion in the Z-direction, while that of J0725-2351 is characteristic for a halo star. |
8. Evolutionary status
Our analysis of J0725-2351 confirms the conclusion of Scholz et al. (2015) that it is an ancient halo main-sequence star. The masses of both stars are slightly lower than the halo turn-off mass. Such stars in globular clusters do not rotate, as shown by Lucatello & Gratton (2003). J1903-0023 shares the fast rotation with the lower-mass counterparts of blue stragglers, called blue lurkers (Leiner et al. 2019; Subramaniam et al. 2020; Dattatrey et al. 2023).
However blue lurkers are formed through the mergers of two low-mass stars, through stellar collisions in dense environments, mass transfer through wind Roche-lobe overflow (Sun et al. 2024), or through a stable mass transfer episode (Leiner et al. 2019). Blue lurkers formed by mass transfer need to gain mass from their companions, which are required to have evolved past the main-sequence phase to increase their radii and fill their Roche lobes. Since the companion in our system is suspected to be an unevolved M dwarf, this scenario is highly unlikely.
The short period and old age of the system imply that tidal effects lead to a circularisation of the orbit and the synchronisation of the components’ rotation periods and orbital period (Fleming et al. 2019; Terquem & Martin 2021; Zahn & Bouchet 1989). The rotation period of the sdF, using inclination from the light curve, the spectrophotometric radius, and the fitted v sin i, comes out to 1.190 ± 0.12 days. This is the same period as observed for the orbital period of the system, which suggests that the system is synchronised.
Due to the short period, the Roche-lobe radius of the system is ∼2 R⊙ using the Eggleton approximation (Eggleton 1983). Extending the MIST tracks further, the star will fill its Roche-lobe within the next 1 − 3 Gyr and start the first phase of mass-transfer. Depending on how conservative the mass transfer will be, the M-dwarf companion will gain mass and turn into a blue lurker or even a blue straggler.
9. Summary and conclusion
We reported the spectral, photometric, light curve, and kinematic analysis of the hypervelocity candidate J1903-0023, which has one of the highest tangential velocities in Gaia DR3, and a reanalysis of the high-velocity sdF star J0725-2351 for reference. Using X-shooter at ESO-VLT spectra we derived the atmospheric parameters, abundances, and projected rotation and radial velocities. Using the ZTF light curve and multiple spectra, we confirm the Gaia variability, which lines up well with an M-dwarf companion in a 1.179-day orbit. Comparing spectroscopic Teff and log g measurements with MIST evolutionary tracks, we derived very similar masses of 0.74 ± 0.03 M⊙ and 0.75 ± 0.03 M⊙ for J0725-2351 and J1903-0023, respectively. Despite their location in the Galactic plane, both objects are low metallicity (−2.3 to −2.6) and alpha enhanced ([α/Fe] = 0.44). With their retrograde orbits, they both belong to the Galactic halo, where the close binary fraction of accreted stars has been found to be higher than in situ stars (Bashi et al. 2024).
The spectroscopic distance of J0725-2351 is consistent with its Gaia parallax, but not of J1903-0023, which is significantly closer than indicated by its parallax. The Gaia DR3 parallax is likely underestimated because J1903-0023 is in a close binary and because it lies in a crowded field (see Scholz 2024, for a discussion). Accordingly, its tangential velocity is smaller, and the star is bound to the Galaxy. The Galactic trajectories of the stars differ enormously, with J0725-2351 showing an orbit typical for halo stars, while that of J1903-0023 is unusual because it stays close to the Galactic plane and is very eccentric. We conjecture that its origin lies within a Galactic stream.
The most intriguing difference between the stars is in their rotation. While J0725-2351 is non-rotating (v sin i < 3 km s−1), J1903-0023 is a fast rotator (v sin i = 42.3 ± 2.0 km s−1) with a period that aligns well with its orbital period. The latter is very unusual for an isolated ancient sdF star, but the rotation period matches the orbital period and we conclude that tidal interaction with a close M-dwarf companion has spun up the star. With a period of around 1.179 days, J1903-0023 is one of the tightest known main-sequence binaries in the halo (see Latham et al. 2002, for periods of such binaries where circularisation takes place around 20 days, in comparison to which J1903-0023 is a on a much shorter orbit) and provides a new avenue to study such systems in the field.
Acknowledgments
We thank the anonymous referee for their comments which helped us better understand this system. We also thank Dr. Veronika Schaffenroth for their help with the light curves. A.B. was supported by the Deutsche Forschungsgemeinschaft (DFG) through grant GE2506/18-1. M.D. was supported by the Deutsches Zentrum für Luft- und Raumfahrt (DLR) through grant 50-OR-2304. D.B. acknowledges financial support from ANID-Subdirección de Capital Humano/Doctorado Nacional/2025-21250735. Based on observations collected at the European Southern Observatory under ESO programmes 112.26Z3.001 and 093.D-0127. Fitting procedures were done on the clusters of University of Potsdam, and Dr. Karl-Remeis Sternwarte, Bamberg. This work has made use of data from the European Space Agency (ESA) mission Gaia (https://www.cosmos.esa.int/gaia), processed by the Gaia Data Processing and Analysis Consortium (DPAC, https://www.cosmos.esa.int/web/gaia/dpac/consortium). Funding for the DPAC has been provided by national institutions, in particular the institutions participating in the Gaia Multilateral Agreement. This research has made use of the VizieR catalogue access tool, CDS, Strasbourg, France (Ochsenbein et al. 2000) and the SIMBAD database, operated at CDS, Strasbourg, France (Wenger et al. 2000). The data presented here were obtained [in part] with ALFOSC, which is provided by the Instituto de Astrofisica de Andalucia (IAA) under a joint agreement with the University of Copenhagen and NOT. Based in part on observations obtained at the Southern Astrophysical Research (SOAR) telescope, which is a joint project of the Ministério da Ciência, Tecnologia e Inovações (MCTI/LNA) do Brasil, the US National Science Foundation’s NOIRLab, the University of North Carolina at Chapel Hill (UNC), and Michigan State University (MSU).
References
- Allen, C., & Santillan, A. 1991, Rev. Mexicana Astron. Astrofis., 22, 255 [Google Scholar]
- Anguiano, B., Majewski, S. R., Hayes, C. R., et al. 2020, AJ, 160, 43 [NASA ADS] [CrossRef] [Google Scholar]
- Bashi, D., Belokurov, V., & Hodgkin, S. 2024, MNRAS, 535, 949 [Google Scholar]
- Bellm, E. C., Kulkarni, S. R., Graham, M. J., et al. 2019, PASP, 131, 018002 [Google Scholar]
- Bonaca, A., Naidu, R. P., Conroy, C., et al. 2021, ApJ, 909, L26 [NASA ADS] [CrossRef] [Google Scholar]
- Boubert, D., Guillochon, J., Hawkins, K., et al. 2018, MNRAS, 479, 2789 [Google Scholar]
- Chambers, K. C., Magnier, E. A., Metcalfe, N., et al. 2016, ArXiv e-prints [arXiv:1612.05560] [Google Scholar]
- Choi, J., Dotter, A., Conroy, C., et al. 2016, ApJ, 823, 102 [Google Scholar]
- Conroy, K. E., Kochoska, A., Hey, D., et al. 2020, ApJS, 250, 34 [Google Scholar]
- Cutri, R. M., Skrutskie, M. F., van Dyk, S., et al. 2003, VizieR Online Data Catalog: II/246 [Google Scholar]
- Cutri, R. M., Wright, E. L., Conrow, T., et al. 2021, VizieR Online Data Catalog: II/328 [Google Scholar]
- Dattatrey, A. K., Yadav, R. K. S., Kumawat, G., et al. 2023, MNRAS, 523, L58 [CrossRef] [Google Scholar]
- Dotter, A. 2016, ApJS, 222, 8 [Google Scholar]
- Eggleton, P. P. 1983, ApJ, 268, 368 [Google Scholar]
- El-Badry, K., Shen, K. J., Chandra, V., et al. 2023, Open J. Astrophys., 6, 28 [CrossRef] [Google Scholar]
- Fleming, D. P., Barnes, R., Davenport, J. R. A., & Luger, R. 2019, ApJ, 881, 88 [Google Scholar]
- Foreman-Mackey, D., Hogg, D. W., Lang, D., & Goodman, J. 2013, PASP, 125, 306 [Google Scholar]
- Gaia Collaboration 2022a, VizieR Online Data Catalog: I/355 [Google Scholar]
- Gaia Collaboration 2022b, VizieR Online Data Catalog: I/358 [Google Scholar]
- Gaia Collaboration (Vallenari, A., et al.) 2023, A&A, 674, A1 [NASA ADS] [CrossRef] [EDP Sciences] [Google Scholar]
- Hawkins, K., & Wyse, R. F. G. 2018, MNRAS, 481, 1028 [NASA ADS] [CrossRef] [Google Scholar]
- Heber, U., Irrgang, A., & Schaffenroth, J. 2018, Open Astron., 27, 35 [Google Scholar]
- Horvat, M., Conroy, K. E., Jones, D., & Prša, A. 2019, ApJS, 240, 36 [Google Scholar]
- Irrgang, A., Wilcox, B., Tucker, E., & Schiefelbein, L. 2013, A&A, 549, A137 [NASA ADS] [CrossRef] [EDP Sciences] [Google Scholar]
- Irrgang, A., Przybilla, N., Heber, U., et al. 2014, A&A, 565, A63 [NASA ADS] [CrossRef] [EDP Sciences] [Google Scholar]
- Irrgang, A., Kreuzer, S., & Heber, U. 2018, A&A, 620, A48 [NASA ADS] [CrossRef] [EDP Sciences] [Google Scholar]
- Kurucz, R. L. 1996, in M.A.S.S., Model Atmospheres and Spectrum Synthesis, eds. S. J. Adelman, F. Kupka, & W. W. Weiss, ASP Conf. Ser., 108, 160 [Google Scholar]
- Latham, D. W., Stefanik, R. P., Torres, G., et al. 2002, AJ, 124, 1144 [NASA ADS] [CrossRef] [Google Scholar]
- Leiner, E., Mathieu, R. D., Vanderburg, A., Gosnell, N. M., & Smith, J. C. 2019, ApJ, 881, 47 [Google Scholar]
- Li, Q.-Z., Huang, Y., Dong, X.-B., et al. 2023, AJ, 166, 12 [NASA ADS] [CrossRef] [Google Scholar]
- Lucas, P. W., Hoare, M. G., Longmore, A., et al. 2008, MNRAS, 391, 136 [Google Scholar]
- Lucatello, S., & Gratton, R. G. 2003, A&A, 406, 691 [NASA ADS] [CrossRef] [EDP Sciences] [Google Scholar]
- Martin, N. F., Ibata, R. A., Starkenburg, E., et al. 2022, MNRAS, 516, 5331 [NASA ADS] [CrossRef] [Google Scholar]
- Masci, F. J., Laher, R. R., Rusholme, B., et al. 2019, PASP, 131, 018003 [Google Scholar]
- Moe, M., Kratter, K. M., & Badenes, C. 2019, ApJ, 875, 61 [NASA ADS] [CrossRef] [Google Scholar]
- Monguió, M., Greimel, R., Drew, J. E., et al. 2020, A&A, 638, A18 [NASA ADS] [CrossRef] [EDP Sciences] [Google Scholar]
- Nelson, T., Hawkins, K., Reggiani, H., et al. 2024, MNRAS, 532, 2875 [Google Scholar]
- Nissen, P. E., Amarsi, A. M., Skúladóttir, Á., & Schuster, W. J. 2024, A&A, 682, A116 [NASA ADS] [CrossRef] [EDP Sciences] [Google Scholar]
- Ochsenbein, F., Bauer, P., & Marcout, J. 2000, A&AS, 143, 23 [NASA ADS] [CrossRef] [EDP Sciences] [Google Scholar]
- Onken, C. A., Wolf, C., Bessell, M. S., et al. 2024, PASA, 41, e061 [NASA ADS] [CrossRef] [Google Scholar]
- Paxton, B., Bildsten, L., Dotter, A., et al. 2011, ApJS, 192, 3 [Google Scholar]
- Paxton, B., Cantiello, M., Arras, P., et al. 2013, ApJS, 208, 4 [Google Scholar]
- Paxton, B., Marchant, P., Schwab, J., et al. 2015, ApJS, 220, 15 [Google Scholar]
- Prša, A., & Zwitter, T. 2005, ApJ, 628, 426 [Google Scholar]
- Prša, A., Conroy, K. E., Horvat, M., et al. 2016, ApJS, 227, 29 [Google Scholar]
- Reggiani, H., Ji, A. P., Schlaufman, K. C., et al. 2022, AJ, 163, 252 [NASA ADS] [CrossRef] [Google Scholar]
- Scholz, R. D. 2024, A&A, 685, A162 [NASA ADS] [CrossRef] [EDP Sciences] [Google Scholar]
- Scholz, R. D., Heber, U., Heuser, C., et al. 2015, A&A, 574, A96 [NASA ADS] [CrossRef] [EDP Sciences] [Google Scholar]
- Schönrich, R., Binney, J., & Dehnen, W. 2010, MNRAS, 403, 1829 [NASA ADS] [CrossRef] [Google Scholar]
- Schuster, W. J., Moreno, E., Nissen, P. E., & Pichardo, B. 2012, A&A, 538, A21 [NASA ADS] [CrossRef] [EDP Sciences] [Google Scholar]
- Subramaniam, A., Pandey, S., Jadhav, V. V., & Sahu, S. 2020, J. Astrophys. Astron., 41, 45 [NASA ADS] [CrossRef] [Google Scholar]
- Sun, M., Levina, S., Gossage, S., et al. 2024, ApJ, 969, 8 [Google Scholar]
- Terquem, C., & Martin, S. 2021, MNRAS, 507, 4165 [CrossRef] [Google Scholar]
- Virtanen, P., Gommers, R., Oliphant, T. E., et al. 2020, Nat. Meth., 17, 261 [Google Scholar]
- Wenger, M., Ochsenbein, F., Egret, D., et al. 2000, A&AS, 143, 9 [NASA ADS] [CrossRef] [EDP Sciences] [Google Scholar]
- Wojtkowska, G., & Poleski, R. 2024, AJ, 167, 225 [Google Scholar]
- Zahn, J. P., & Bouchet, L. 1989, A&A, 223, 112 [NASA ADS] [Google Scholar]
Appendix A: Spectra
The X-Shooter spectrum of J1903-0023 is shown in Fig. A.1. We model this as a single star spectrum with no visible contamination through a secondary component. Table A.1 shows the different RVs for the system. Fig. C.1 shows the difference in RV. The spectra obtained with NOT/ALFOSC and SOAR/Goodman were reduced using an open-source pipeline available on GitHub3. The reduction process included standard bias subtraction and flat-field correction. Wavelength calibration was performed using arc lamp exposures taken immediately prior to each science observation.
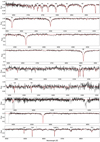 |
Fig. A.1. X-shooter spectrum from the UVB and VIS arms with a best-fit model. The normalised flux is shown with solid black lines and the best-fit model is shown with dashed red lines. The parts of the spectra that were not considered in the fit are marked with a dashed black line and include diffuse interstellar bands due to the high reddening. The panels have different flux ranges. The strongest lines of hydrogen, magnesium, calcium, and iron are also marked. The Paschen lines are marked in the infrared, and some of them blend with Ca II lines. |
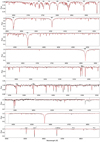 |
Fig. A.2. X-shooter spectrum of J0725-2351 from the UVB and VIS arms with a best-fit model (see Fig. A.1 for explanations). |
Radial velocity measurements from different instruments. Uncertainties are systematic.
Appendix B: Tracks and future evolution
The MIST tracks are shown in Fig.B.2 Fig. B.1.
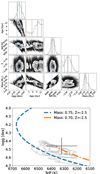 |
Fig. B.1. Corner plots and evolutionary tracks for stellar parameters of J0725-2351. Upper panel: Posterior distribution of the interpolated values for log g, Age, Teff, metallicity, and mass. The blue lines in the corner plot show the observed values for the star. Lower panel: Tracks are shown for comparison for 0.75 M⊙ and 0.70 M⊙ at a metallicity of −2.5. The grey contours show the sampled distribution. |
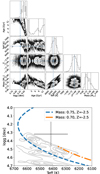 |
Fig. B.2. Corner plots and evolutionary tracks for stellar parameters of J1903-0023. Upper panel: Posterior distribution of the interpolated values for log g, Age, Teff, metallicity, and mass. The blue lines in the corner plot show the observed values for the star. Lower panel: Tracks are shown for comparison for 0.75 M⊙ and 0.70 M⊙ at a metallicity of −2.5. The grey contours show the sampled distribution. |
Appendix C: SEDs
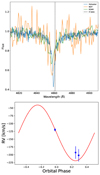 |
Fig. C.1. [Top]: Normalised H beta (dashed black line) is shown for comparison from Xshooter (blue), NOT (orange), and SOAR (green). The spectral resolutions are different for all three. [Bottom]: Phase-folded RV curve with γ = −130 km s−1. |
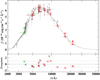 |
Fig. C.2. Spectral energy distribution of J1903-0023. The best-fit model is plotted in grey. Photometric values are taken from 2MASS (Cutri et al. 2003), IGAPS (Monguió et al. 2020), Pan-STARRS (Chambers et al. 2016), Skymapper DR4 (Onken et al. 2024), and UKIDSS DR6 (Lucas et al. 2008). The residuals are shown below. |
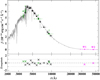 |
Fig. C.3. Best-fit SED model for J0725-2351 is shown in grey. Points from Gaia XP spectra (Gaia Collaboration 2022a), Skymapper (Onken et al. 2024), and Wise (Cutri et al. 2021) are marked in black, green, and pink. Residuals are shown below. |
Appendix D: Light curve modelling
We modelled the light curve by setting ’irrad_frac_refl_bol’ of the primary to 1.0 and using the Horvat scheme (Horvat et al. 2019). While the light curve was modelled setting pblum to dataset-scaled, this was later changed by sampling also pblum in the emcee run. The mass of the primary was kept fixed, allowing a better estimate of q. However, the light curve is not precise enough to get a reliable mass fraction, and further RV follow-up is needed to properly solve the system.
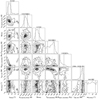 |
Fig. D.1. Corner plot for the sampled parameters modelled in PHOEBE. |
Appendix E: Galactic origin of the stars
For J1903-0023 the trajectory (see Fig. 4) and the Lz-energy diagram (Fig. E.1) suggest that the star was accreted in a merger event. Similarly, unlike in situ halo stars that are predicted to have lower rmax (Schuster et al. 2012), this star has a much higher rmax. However, the accretion-based origin does not line up well with the low [Fe/H], high [α/Fe] values of the star. Based on its surface composition, the star resembles the in situ halo, since accreted stars are predicted to have lower α enhancement (Nissen et al. 2024). The position of the star in Fig. E.1 along with its metallicity shows that it is close to both the region of the Phlegethon stream and nearby the Sequoia merger (values adapted from Bonaca et al. 2021; Martin et al. 2022).
The Lz-energy coordinates (see Fig. E.1) place J0725-2351 between the Gaia-Sausage and close to the Fimbulthul stream, which is the stream coming from the ω Cen globular cluster (values adapted from Bonaca et al. 2021; Martin et al. 2022). The high [α/Fe] value therefore implies that it is likely to be of in situ origin and the Lz-energy values are merely coincidental.
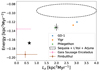 |
Fig. E.1. Lz-Energy plot of retrograde streams with [Fe/H]< − 1.5, as well as the two stars. J1903-0023 is marked with the cross, and J0725-2351 is marked with the star. |
All Tables
Best-fit parameters for X-shooter spectrum fitted using a χ2-minimisation method with statistical uncertainties.
Radial velocity measurements from different instruments. Uncertainties are systematic.
All Figures
|
Fig. 1. Mg I and Ca II triplets in the normalised and RV-corrected spectra of J1903-0023 (solid) and J0725-2351 (dash-dotted). The rotational velocity broadening can be clearly seen for J1903-0023. The resolving power is 6655 for the blue arm and 8935 for the VIS arm for J0725-2351, and the spectrum of J1903-0023 was convolved to match it. |
| In the text | |
|
Fig. 2. ZTF LC phase-folded with a period of 1.179 days. The blue line is the PHOEBE model. |
| In the text | |
|
Fig. 3. Toomre diagram for J1903-0023 (cross) and J0725-2351 (star). The 3σ contours of the thin disc (blue), the thick disc (green), and the halo (grey) are constructed from the U, V, and W distributions of Anguiano et al. (2020). U is the velocity component towards the Galactic centre, V in the direction of Galactic rotation, and W perpendicular to the Galactic plane. |
| In the text | |
|
Fig. 4. Galactic orbits for J1903-0023 (left panel) and J0725-2351 (right panel), in a Galactic Cartesian coordinate system with the z-axis pointing to the Galactic north pole, calculated back in time for 15 Gyr. The Galactic centre is marked with a plus sign, the location of the Sun at x = −8.33 ± 0.35 kpc is shown as an orange circle. J1903-0023 has a peculiar trajectory with no significant motion in the Z-direction, while that of J0725-2351 is characteristic for a halo star. |
| In the text | |
|
Fig. A.1. X-shooter spectrum from the UVB and VIS arms with a best-fit model. The normalised flux is shown with solid black lines and the best-fit model is shown with dashed red lines. The parts of the spectra that were not considered in the fit are marked with a dashed black line and include diffuse interstellar bands due to the high reddening. The panels have different flux ranges. The strongest lines of hydrogen, magnesium, calcium, and iron are also marked. The Paschen lines are marked in the infrared, and some of them blend with Ca II lines. |
| In the text | |
|
Fig. A.2. X-shooter spectrum of J0725-2351 from the UVB and VIS arms with a best-fit model (see Fig. A.1 for explanations). |
| In the text | |
|
Fig. B.1. Corner plots and evolutionary tracks for stellar parameters of J0725-2351. Upper panel: Posterior distribution of the interpolated values for log g, Age, Teff, metallicity, and mass. The blue lines in the corner plot show the observed values for the star. Lower panel: Tracks are shown for comparison for 0.75 M⊙ and 0.70 M⊙ at a metallicity of −2.5. The grey contours show the sampled distribution. |
| In the text | |
|
Fig. B.2. Corner plots and evolutionary tracks for stellar parameters of J1903-0023. Upper panel: Posterior distribution of the interpolated values for log g, Age, Teff, metallicity, and mass. The blue lines in the corner plot show the observed values for the star. Lower panel: Tracks are shown for comparison for 0.75 M⊙ and 0.70 M⊙ at a metallicity of −2.5. The grey contours show the sampled distribution. |
| In the text | |
|
Fig. C.1. [Top]: Normalised H beta (dashed black line) is shown for comparison from Xshooter (blue), NOT (orange), and SOAR (green). The spectral resolutions are different for all three. [Bottom]: Phase-folded RV curve with γ = −130 km s−1. |
| In the text | |
|
Fig. C.2. Spectral energy distribution of J1903-0023. The best-fit model is plotted in grey. Photometric values are taken from 2MASS (Cutri et al. 2003), IGAPS (Monguió et al. 2020), Pan-STARRS (Chambers et al. 2016), Skymapper DR4 (Onken et al. 2024), and UKIDSS DR6 (Lucas et al. 2008). The residuals are shown below. |
| In the text | |
|
Fig. C.3. Best-fit SED model for J0725-2351 is shown in grey. Points from Gaia XP spectra (Gaia Collaboration 2022a), Skymapper (Onken et al. 2024), and Wise (Cutri et al. 2021) are marked in black, green, and pink. Residuals are shown below. |
| In the text | |
|
Fig. D.1. Corner plot for the sampled parameters modelled in PHOEBE. |
| In the text | |
|
Fig. E.1. Lz-Energy plot of retrograde streams with [Fe/H]< − 1.5, as well as the two stars. J1903-0023 is marked with the cross, and J0725-2351 is marked with the star. |
| In the text | |
Current usage metrics show cumulative count of Article Views (full-text article views including HTML views, PDF and ePub downloads, according to the available data) and Abstracts Views on Vision4Press platform.
Data correspond to usage on the plateform after 2015. The current usage metrics is available 48-96 hours after online publication and is updated daily on week days.
Initial download of the metrics may take a while.