| Issue |
A&A
Volume 700, August 2025
|
|
|---|---|---|
| Article Number | A115 | |
| Number of page(s) | 19 | |
| Section | Atomic, molecular, and nuclear data | |
| DOI | https://doi.org/10.1051/0004-6361/202554933 | |
| Published online | 07 August 2025 | |
Vacuum ultraviolet photoabsorption spectroscopy of space-related ices: Formation of (cyano)polyynes in 1 keV electron irradiated hydrocarbon-rich ices
1
Astronomical Institute, Slovak Academy of Sciences, Tatranská Lomnica 059 60, Slovakia
2
Centre for Interstellar Catalysis (InterCat), Department of Physics and Astronomy, Aarhus University, 8000 Aarhus, Denmark
3
HUN-REN Institute for Nuclear Research (Atomki), Debrecen 4026, Hungary
4
School of Electronic Engineering and Computer Science, Queen Mary University of London, London E1 4NS, UK
5
Centre for Storage Ring Facilities (ISA), Department of Physics and Astronomy, Aarhus University, 8000 Aarhus, Denmark
6
Physics and Astronomy, School of Engineering, Mathematics and Physics, University of Kent, Canterbury CT2 7NH, UK
7
INAF – Osservatorio Astrofisico di Catania, Catania 95123, Italy
★★ Corresponding author: This email address is being protected from spambots. You need JavaScript enabled to view it.
Received:
1
April
2025
Accepted:
23
June
2025
Abstract
Context. The irradiation of condensed hydrocarbons at low temperatures may result in the production of larger, more complex carbon-rich species relevant to biology. This chemistry may therefore influence the prebiotic potential of astronomical environments.
Aims. We have sought to use vacuum-ultraviolet (VUV) photoabsorption spectroscopy to characterise the production of complex carbon-bearing molecules (particularly polyynes and cyanopolyynes) as a result of the 1 keV electron irradiation of neat CH4, C2H4, C2H6, C3H8, C6H14, and C8H18 astrophysical ice analogues as well as their binary mixtures with N2 and NH3.
Methods. Ices were nominally prepared and irradiated at low temperatures in an ultra-high-vacuum astrochemistry chamber and the ensuing radiation chemistry was followed via VUV photoabsorption spectroscopy. Following their irradiation, the ices were warmed to allow volatile species to sublimate. Residual refractory species were spectroscopically analysed.
Results. The irradiation of neat hydrocarbon ices promotes the synthesis of a number of polyynes (i.e. C8H2 and C10H2, and possibly C12H2, C14H2, and C16H2) that were identified through the emergence of new features in acquired VUV spectra and that largely remain in the solid phase during post-irradiative warming. When hydrocarbons were mixed with N2 or NH3 and irradiated, mixtures of polyynes and cyanopolyynes were formed (i.e. C8H2, HC7N, HC9N, and C6N2); with product yields being greater in irradiated binary ices containing NH3 compared to ones containing N2. Such results suggest that the radiolytic synthesis of (cyano)polyynes in hydrocarbon-and nitrogen-rich icy space environments (such as dense interstellar clouds or the Pluto-Charon system) is plausible.
Key words: astrochemistry / molecular processes / dust, extinction / ISM: molecules
These authors contributed equally to this work as co-first authors.
© The Authors 2025
 Open Access article, published by EDP Sciences, under the terms of the Creative Commons Attribution License (https://creativecommons.org/licenses/by/4.0), which permits unrestricted use, distribution, and reproduction in any medium, provided the original work is properly cited.
This article is published in open access under the Subscribe to Open model. This email address is being protected from spambots. You need JavaScript enabled to view it. to support open access publication.
1 Introduction
The energetic processing of ices in space environments by ions, electrons, and ultraviolet photons is known to induce a rich radiation chemistry that may lead to the formation of so-called complex organic molecules (COMs) of significant relevance to spectroscopy, geochemistry, or astrobiology (Öberg 2016; Jørgensen et al. 2020; Sandford et al. 2020). Of particular interest are the formation and chemistry of molecules that are relatively abundant in space and that could act as precursors to species directly relevant to biochemical and life-sustaining processes, such as amino acids or sugars. Among such COMs are the straight-chain polyynes and cyanopolyynes. These are classes of molecules characterised by sp-hybridised carbon atoms linked by a series of alternating single and triple covalent bonds (-O≡C)n that are bound by two terminal hydrogen atoms (in the case of polyynes) or by one or two cyano groups (-CN) (in the case of cyanopolyynes). These species have been observed in several astronomical environments across the interstellar medium, including pre-stellar cores (Cordiner et al. 2011; Bianchi et al. 2023), star-forming regions (Cordiner et al. 2011; Wang et al. 2022; Al-Edhari et al. 2017), and the outer envelopes of carbon-rich stars (Cherchneff et al. 1993; Cernicharo 2004). Within the outer Solar System, these species are also believed to contribute to the tholin material found within the atmospheric haze of Titan (Kunde et al. 1981; Hanel et al. 1981; Marten et al. 2002) and are possibly present on the icy surface of Pluto (Fayolle et al. 2021).
Cyanopolyynes in particular may also be of significant astrobiological interest, due to the hypothesised role of these molecules as precursors to amino acids in space environments (Boyd et al. 1981; Balucani & Kaiser 2005). This relevance to biology, combined with the apparent ubiquity of these molecules in various regions of space, has provided a strong motivation to perform laboratory experiments in order to better understand the astrochemical processes in which (cyano)polyynes may participate. Most recently, Fedoseev et al. (2025) performed experiments that demonstrated that polyynes in dense molecular clouds in the interstellar medium may participate in surface hydrogenation reactions to produce fully saturated alkanes. In terms of (cyano)polyyne formation in space, previous work has demonstrated that the irradiation of simple hydrocarbon-rich targets results in the formation of polyynes (Compagnini et al. 2009; Cuylle et al. 2014; Puglisi et al. 2014; Ramadhan et al. 2017; Zhao et al. 2017). In addition, cyanopolyynes have been shown to form when hydrocarbon-rich ices that also contain nitrogen-containing molecules are irradiated (Crépin et al. 2011; Gudipati et al. 2013; Szczepaniak et al. 2017).
Note that most previous experiments used infrared absorption spectroscopy to understand the chemistry of (cyano)polyynes under space-relevant conditions. Although infrared absorption spectroscopy is the traditional analytical technique of choice in laboratory astrochemistry experiments and offers many advantages (Ioppolo et al. 2014; Mifsud et al. 2021; Cuppen et al. 2024), there is a growing appreciation for absorption spectra acquired in the ultraviolet spectral range. This is largely due to its successful exploitation in investigating the icy surface compositions of outer Solar System objects (Krasnopolsky 2001; Hendrix et al. 2011; Becker et al. 2022; Migliorini et al. 2022; Ramachandran et al. 2024). Moreover, launched missions such as the Jupiter Icy Moons Explorer (JUICE) and the Europa Clipper will also observe icy surfaces in the outer Solar System in the ultraviolet spectral range. Laboratory-generated spectra in the same wavelength regions can be compared to observational data acquired by these missions to enhance our understanding of the surface compositions of outer Solar System bodies. To this end, previous laboratory work has already shown that solid-phase polyynes and cyanopolyynes that have 20 carbon atoms or fewer present identifiable absorption bands at wavelengths <350 nm (Cataldo 2004a; Crépin et al. 2011; Cuylle et al. 2014), making ultraviolet spectroscopy an attractive and feasible tool for studying the formation and chemistry of (cyano)polyynes in low-temperature environments.
Despite the apparent utility of ultraviolet spectroscopy in detecting COMs such as polyynes and cyanopolyynes in astronomical ices, there currently exists little spectroscopic literature data in the vacuum-ultraviolet (VUV) range (<200 nm), likely due to the need for large synchrotron facilities to access these wavelengths. Most of the data that exist are largely concerned with characterising the spectra of neat astrophysical ices or simple mixtures, and work on irradiated ices (Pavithraa et al. 2019; James et al. 2019; Ioppolo et al. 2020, 2021; James et al. 2021; Mifsud et al. 2022; Thombre et al. 2022; Zhang et al. 2024) has only been published in recent years. Such a scenario is problematic, as the aforementioned space missions will collect data in this spectral range from astronomical targets that exist in radiation environments mediated by stellar winds, giant planetary magnetospheric plasmas, and galactic cosmic rays. Thus, there is a pressing need for additional laboratory data to interpret the acquired observational data.
In this article, we present the VUV photoabsorption spectra of 1 keV electron irradiated molecular ices rich in hydrocarbons, including neat methane (CH4), ethylene (C2H4), ethane (C2H6), propane (C3H8), hexane (C6H14), and octane (C8H18), as well as their binary mixtures with molecular nitrogen (N2) and ammonia (NH3) in an effort to constrain the radiation chemistry leading to the formation of polyynes and cyanopolyynes in astrophysical ices. This work is the third instalment in a series of VUV spectroscopic studies of irradiated astrophysical ice analogues (Ioppolo et al. 2020, 2021) carried out with the aim of supporting the astronomical observations made by current and forthcoming space missions. Information on the experimental methodology can be found in Section 2, while our results are described in Section 3. Some astrophysical implications of our work are described in Section 4 and concluding remarks are provided in Section 5.
2 Experimental methodology
The laboratory experiments described herein were performed at the AU-UV beam line at the ASTRID2 synchrotron facility at Aarhus University in Denmark. We used the high-energy grating on the beam line to access the 120-340 nm spectral range with a typical VUV flux of 1010 photons s-1 per 100 mA and a photon resolution of 0.08 nm (Eden et al. 2006; Palmer et al. 2015). We prepared, irradiated, and spectroscopically studied ices using two geometrically similar custom-made ultra-high vacuum chambers with an operational base pressure of better than 10-9 mbar and a magnesium fluoride (MgF2) substrate in their centre that can be cooled to cryogenic temperatures. Experiments conducted at 8 K were performed using a 4 K Advanced Research Systems cryostat and a SPECS EQ 22/35 electron gun, while those carried out at 21 K were performed using the set-up described in Ioppolo et al. (2020, 2021) that comprises a Sumitomo DE-202B cryocooler and a Kimball Physics FRA-2X1-5549 electron gun. For a complete list of experiments, see Table 1. The SPECS EQ 22/35 electron gun was set to irradiate with an electron energy of 1 keV and a current of 30 μA. These values were chosen such that both electron guns provided the same electron energy and flux of 2 × 10¹³ e- cm-2 s-1 to their respective irradiated ices (for details on how this flux was calculated, see Ioppolo et al. 2020). The experimental procedure described in the following was identical regardless of the system used.
During a standard experiment, the MgF2 substrate was first cooled to the base temperature and then rapidly heated to 200 K in order to remove any possible contaminants from its surface. Once re-cooled to 8 K (or 21 K), a background VUV photoabsorption scan was collected and used as a reference for subsequently acquired sample scans. All scans were acquired in transmission mode with a wavelength step of 1 nm. The background and sample scan data were used to calculate the absorbance at each wavelength step, A (λ), in every spectrum using the following equation:
 (1)
(1)
where IB (λ) is the measured detector signal (in nanoamps) of the spectrum’s associated background scan, and IS (λ) is the measured detector signal (in nanoamps) of the spectrum’s associated sample scan.
Neat CH4, C2H4, C2H6, C3H8, C6H14, and C8H18 ices and their binary mixtures with N2 and NH3 were prepared by first introducing the relevant gases or vapours into a pre-mixing line, where their partial pressures could be determined using a mass-independent capacitive manometer. Gases were used as received from Sigma-Aldrich (99.95% purity for CH4, C2H6, C3H8, and C2H4) and Praxair (>99% purity for NH3), while liquid C6H14 and C8H18 were received from Sigma-Aldrich at >95% purity and de-gassed using the standard freeze-pump-thaw technique. After their preparation in the pre-mixing line, the gases and vapours were dosed into the main chamber through an allmetal needle valve and condensed on the MgF2 substrate at low temperature. During deposition, the chamber pressure was monitored by means of a full-range gauge.
The thicknesses of the deposited astrophysical ice analogues were determined using a laser interference technique that has previously been described in detail (Goodman 1978). This technique is based on monitoring the intensity variations of a laser beam reflected at 20° to the normal of the substrate surface during ice deposition. During deposition, a sinusoidal variation in intensity is detected due to interference of the laser light reflected from the ice-vacuum and ice-substrate boundaries, which varies as a function of the thickness of the ice, d (μm). The number of consecutive pattern repetitions, k, is related to this thickness as follows:
 (2)
(2)
where λ0 is the wavelength of the laser light in vacuo (632.8 nm), n is the refractive index of the depositing ice, and θ is the reflection angle of the laser light in the ice. In general, ice layers were deposited to thicknesses of 10-50 nm. More information on the properties of the deposited ices considered in this study is given in Table 1.
Once an ice of a desired molecular composition and thickness was deposited, a pre-irradiation VUV photoabsorption spectrum was acquired. The ice was then exposed to a 1 keV electron beam such that the electrons impacted the ice normal to the plane of the substrate. The penetration depths of incident electrons into the target ices were calculated using the CASINO software package (see Fig. 1 and Drouin et al. 2007).
The stopping power of the 1 keV electrons (i.e. the energy released per unit length as the electrons travelled through the ice) was determined considering both implanted and transmitted electrons. Because the ice layer is thinner than the calculated penetration depth of the electrons, a fraction of the incident electrons pass through, while others become implanted, depositing all their energy within the ice. The energy losses calculated for electron backscattering ranged from 4-5% of the initial kinetic energy, which is expected to have a negligible effect on the overall approximation. The ratio of implanted to transmitted electrons, as well as the fraction of energy released by passing electrons, was simulated using the CASINO software (Drouin et al. 2007). The stopping power, expressed in eV/Å, was calculated as the sum of the energy released by the implanted electrons and the partial energy deposition of the transmitted electrons, divided by the thickness of the ice. Due to the very small ice thickness compared to the penetration depth, the energy release within this thin layer was considered to be linear. The final dose values of energy, obtained by multiplying the stopping power by the total electron fluence during irradiation, are listed in Table 1.
Several VUV photoabsorption spectra were acquired during the irradiation process at pre-defined fluence intervals. Following the conclusion of the irradiation process, the ices were warmed with additional spectra acquired at 20, 50, 80, 110, 140, 200, and 300 K (with the exception of the CH4:N2, C2H4:N2, and C2H6:N2 mixed ices that were only warmed to 140 K). With all volatile ice components sublimated, the room-temperature MgF2 substrate was subsequently re-cooled to 8 K (or 21 K) to acquire a VUV photoabsorption spectrum of any remaining refractory organic residues.
Properties of the ices investigated in this study.
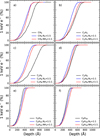 |
Fig. 1 Results of CASINO simulations showing the percentage of incident electrons implanted into the ices as a function of penetration depth. Each simulation considered the trajectories of 1000 electrons. |
3 Results and discussion
3.1 VUV photoabsorption spectra of irradiated neat hydrocarbon ices
Figure 2 shows the VUV photoabsorption spectra of the neat ices CH4, C2H4, and C2H6 before and at several stages during 1 keV electron irradiation at 8 K, as well as during post-irradiative warming. The VUV spectrum of solid CH4 is characterised by a single absorption band at 124 nm (Figure 2a) that decreases with increasing electron fluence due to radiolytic destruction of this species, as well as a broad feature towards wavelengths greater than 200 nm that also decreases with increasing electron fluence. During irradiation, it was noted that the 124 nm band shifts slightly to lower wavelengths and that a new absorption band appears at approximately 175 nm. The decrease in the broad feature in the long-wavelength region during irradiation reveals an absorption feature at approximately 230 nm, which decreases in absorbance but becomes more clearly defined with increasing electron fluence. The VUV spectrum of solid C2H4 exhibits a peak at 123 nm and two broad absorption features centred at 158 and 173 nm (Figure 2b), and these bands decrease with increasing electron fluence as the C2H4 molecules are radiolytically destroyed, while a broad band appears at approximately 230 nm and increases with increasing radiation. An additional small absorbance feature appears at approximately 285 nm and also increases with increasing radiation. The pre-irradiation VUV spectrum of C2H6 exhibits no absorption over the 200-340 nm range, but does contain a small double-peaked absorption feature at approximately 162 and 167 nm, and a large increase in absorbance as the wavelength decreases below 150 nm. It reaches its maximum value at a plateau from 130 nm towards the lower limit of the studied spectral range (Figure 2c). The absorption features of C2H6 below 150 nm were noted to decline during irradiation due to their radiolytic destruction, and an increase in absorption appears with increasing irradiation appears at 174 nm. This feature is likely a new feature rather than a shift in the position of the C2H6 167 nm feature, as there is no such shift towards longer wavelengths of the 162 nm C2H6 feature. A second new feature appears at 230 nm after irradiation, and grew in absorbance with increasing electron fluence while also shifting slightly to 233 nm.
The VUV photoabsorption spectra of the neat C3H8, C6H14, and C8H18 ices prior to and at several stages during 1 keV electron irradiation at 8 K are shown in Figure 3. The VUV spectrum of solid C3H8 is largely flat at wavelengths >160 nm, with a broad absorption feature peaking towards our lower wavelength limit of 120 nm, while also exhibiting a shoulder at 133 nm. With increasing electron fluence, this shoulder vanishes while the absorbance of the overall peak increases slightly. Electron irradiation causes a succession of small peaks to appear at 177, 235, 276, 299, and 326 nm, which all grow in absorbance with increasing electron fluence. The VUV photoabsorption spectra of the neat C6H14 ice are, at first glance, very similar to those of the C3H8 ice; however, the shoulder feature at 133 nm is absent in the C6H14 spectra. The series of peaks >150 nm is again present, at wavelength values of 180, 236, 277, 300, and 330 nm; somewhat redshifted with respect to those observed in the C3H8 irradiation spectra. The VUV photoabsorption spectra of the neat C8H18 ice are again similar to those of the C3H8 and C6H14 ices. We observe a shoulder-less peak at 120 nm in the pre-irradiation spectrum that shifts to 123 nm after the first electron irradiation but does not further shift upon further irradiation although its absorbance increases. During irradiation of C8H18, peaks appear at 182, 230, and 278 nm. No peaks are distinguishable by eye beyond 300 nm, with a smooth downward slope in absorbance towards longer wavelengths being observed instead.
Previous work in this field has allowed us to interpret these observed results. For example, Bennett et al. (2006) irradiated solid CH4 at 10 K with 5 keV electrons and used a combination of mid-infrared spectroscopy to study the physical and chemical changes in the solid state and quadrupole mass spectrometry to determine the composition of the gas phase in their experimental chamber. These experimental observations were supported by electronic structure calculations that aided in elucidating the reaction network present in electron irradiated CH4 ice. According to these authors, irradiation results in the cleavage of a C—H bond to yield methyl radicals (CH3) and hydrogen atoms; the latter of which undergo combination reactions with each other to produce molecular hydrogen (H2), which was the only species detected in the gas phase during irradiation. CH3 radicals may also combine with each other, in this case producing C2H6 directly. Once formed, C2H6 can be stabilised by the surrounding ice matrix or undergo unimolecular decomposition to produce the ethyl radical (C2H5). A further hydrogen abstraction process leads to the formation of C2H4. This mechanistic chemistry was later corroborated by the works of Abplanalp & Kaiser (2017) and Abplanalp et al. (2018), who made use of a combination of mid-infrared spectroscopy and reflectron time-of-flight mass spectrometry to detect various hydrocarbon molecules and radicals formed as a result of the irradiation of CH4 and C2H4 ices by 5 keV electrons and ultraviolet photons. The described reaction network presented by Bennett et al. (2006) is written in equation form as follows:
 (3)
(3)
 (4)
(4)
 (5)
(5)
 (6)
(6)
The elucidation of this mechanistic chemistry allows us to interpret our results depicted in Figures 2 and 3. Starting with the VUV photoabsorption spectra of the irradiated CH4 ice, we have attributed the emergent band at 175 nm and the minor blueshifting of the large CH4 band to the formation of C2H4 and C2H6. A band at 158 nm that would be expected if C2H4 were present was in fact not observed (Figure 2a), probably due to being obscured by the absorption feature of CH4. Similarly, the absorption features observed over the 150-200 nm range in the spectra of irradiated C2H6 ice (Figure 2c), C3H8 ice (Figure 3a), C6H14 ice (Figure 3b) and C8H18 ice (Figure 3c) are likely attributable to C2H4. It should be noted that the absorption bands ascribed to C2H4 in the irradiated CH4, C2H6, C3H8, C6H14, and C8H18 ices differ somewhat from those observed in the pristine C2H4 ice. This discrepancy is probably a compositional effect, in which the absorption bands of a particular molecular species adopt somewhat different profiles and appearances in ices of different compositions (Ioppolo et al. 2020, 2021; James et al. 2020, 2021). However, all bands attributed to C2H4 in our ices (i.e. those emerging in the VUV spectra of irradiated CH4, C2H6, C3H8, C6H14, and C8H18 ices as well as that in the spectra of irradiated C2H4) behave in a similar way when the ices are subjected to warming: the band at approximately 175 nm begins to broaden and also redshifts to longer wavelengths (Figures 2 and 3). This observation reinforces our assignment by suggesting that these bands are related to the same molecule.
A common feature of the VUV photoabsorption spectra of the studied irradiated neat hydrocarbon ices is a broad band that emerges over the 200-260 nm range during irradiation (Figures 2 and 3). In the case of the irradiated CH4 ice, this band appears centred at 230 nm shortly after the onset of irradiation and becomes increasingly well defined with increasing electron fluence. It should be noted that, unlike the spectra of the other irradiated hydrocarbons, the absorption spectra of the irradiated CH4 undergo a net decrease in absorbance at higher wavelengths (Figure 2a). We speculate that these observations may be related to radiation-induced structural changes that occur within the ice. Upon preparation, our ice is likely some admixture of amorphous and crystalline structures, due to the known difficulties in preparing purely amorphous CH4 ice even at low temperatures (Gerakines & Hudson 2015). It is possible that the crystalline components of the ice are responsible for the broad slope in the VUV photoabsorption spectrum of CH4. This would neatly explain the disappearance of the slope upon the onset of irradiation, which would trigger efficient amorphisation of the crystalline components of the ice (Ferini et al. 2004). However, in any case, the emergent broad band at 230 nm increases in absorbance and subtly redshifts to 233 nm during warming to 140 K (Figure 2d).
In the irradiated C2H6 ice (Figure 2c), the broad band also initially appeared to be centred at 230 nm at the onset of electron irradiation. As the irradiation progressed, the absorbance of this band increased and redshifted to 236 nm. During warming, the absorbance of the band continued to increase and it further red-shifted to 238 nm until a temperature of 110 K was reached, after which the band began to decrease (Figure 2f). The behaviour of this broad band is similar to those of analogous bands observed in the spectra of the irradiated and subsequently warmed C6H14 and C8H18 ices (Figure 3). In each case, the band emerges immediately after the first dose of electron irradiation and continues to grow in absorbance upon further irradiation, with a small redshift towards longer wavelengths. In C6H14 this shift is observed from 236 nm to 238 nm, and in C8H18 this shift is observed from 230 nm to 233 nm. In both the C3H8 and C6H14 ices, the band increases in absorbance upon warming until decreasing slightly at 140 K. In the C8H18 ice, the band increases only subtly upon warming up to 80 K, and greatly increases in absorbance by 140 K as the entire absorbance beyond 160 nm increases. In the C3H8 ice, we did not observe a shift in this band during warming. In that case, the band remains at 235 nm throughout both the irradiation and warming processes (Figures 3a and 3d). In the spectrum of the irradiated C2H4 ice, this band is observed to have a double-peaked structure, at 221 and 230 nm, across all irradiation fluences; and the absorbance and broadness of the band increases with increasing electron fluence (Figure 2b). During warming, the 221 nm peak decreases in absorbance between 50 and 80 K while the 230 nm peak and a broad feature increase in absorbance (Figure 2e). Both peaks vanish, and the broad feature declines in absorbance upon further warming to 110 K and beyond, along with a redshifting of the broad feature to 235 nm by 140 K.
Our spectroscopic observations of this band are remarkably similar to those reported by Cuylle et al. (2014), who considered the photo-processing of solid acetylene (C2H2) at 12 K. Their ultraviolet-visible spectra demonstrated the emergence of two strong bands at 219 and 228 nm that contained a very broad wing, along with several other weak and poorly resolved features at longer wavelengths up to 350 nm. These results, combined with those obtained by Abplanalp & Kaiser (2017) and Abplanalp et al. (2018) on the energetic processing of hydrocarbon ices and those of Cataldo (2004a) on the arcing of submerged graphitic electrodes, together with the band assignments of liquid matrix polyynes determined by Kloster-Jensen et al. (1974), suggest that the strongest features in our spectra between 200-260 nm are likely attributable to octatetrayne (C8H2) and decapentayne (C10H2); members of the polyyne class of molecules. Those authors’ results further support the assignment of the polyyne species dodecahexayne (C12H2), tetradecaheptayne (C14H2), and hexadecaoctayne (C16H2) to the features we observe in the irradiated ices at approximately 275, 290, and 325 nm, respectively; although the low absorbances of features observed beyond 250 nm in our spectra make these identifications less certain. In fact, only in the spectra of the irradiated C3H8 and C6H14 ices are these features clearly distinguishable by eye.
The synthesis of polyyne species in our ices is well explained by the reaction network described by Bennett et al. (2006). In this scheme, C2H4 is dehydrogenated to yield the vinyl radical (HCCH2), which itself may undergo a subsequent dehydrogenation reaction to yield C2H2. Once formed, C2H2 can participate in a polymerisation process in which it is first dehydrogenated to the ethynyl radical (CCH), which can combine with another CCH radical to produce diacetylene (HC≡C-C≡CH). Higher-order polyynes with an even number of carbon atoms are then formed by successive cycles of polyyne dehydrogenation followed by coupling with an ethynyl radical. The dehydrogenation of the hydrocarbons forms H2, which desorbs from the ice. This type of polymerisation chemistry has been observed in synthetic chemistry experiments (Prenzel et al. 2017) and, indeed, has been invoked to partially account for the high abundances of polyynes, cyanopolyynes, and cumulenes observed in the neutral layers of proto-planetary nebulae (Cernicharo 2004). This reaction network is shown in equation form as follows:
 (7)
(7)
 (8)
(8)
 (9)
(9)
 (10)
(10)
 (11)
(11)
The chemical reactions outlined above also go some way to explain the relative abundance of polyyne products obtained after our electron irradiations of the six hydrocarbon species. Since C2H4 is already an unsaturated molecule, it requires the fewest mechanistic steps to produce C2H2 and thence polyynes. In contrast, irradiations of the CH4, C2H6, C3H8, C6H14 and C8H18 ices require additional dehydrogenation and coupling reactions, thus limiting the efficiency of polyyne synthesis. However, longer-chain alkane species can radiolytically fragment into additional radicals, providing additional routes to formation of C2H2. This is reflected in the modest intensity of the polyyne absorption band in the CH4 ice irradiation experiment compared to the other experiments. A similar argument was invoked by Compagnini et al. (2009), who observed the greater formation of polyynes after the 200 keV H+ irradiation at 16 K of C2H2 compared to C2H4.
The absorption features below 200 nm are difficult to identify, as they can be attributable to numerous species. It is reasonable to expect that the fragmentation of the large alkanes C6H14 and C8H18 could simply form shorter alkanes or other hydrocarbons that are not polyynes, yet many of these potential molecular species absorb only towards the low-wavelength region of our studied spectral range. This, combined with the lack of reference VUV spectra in the literature, makes the unique identification of all possibly formed hydrocarbons difficult. However, a close examination of a wavelength region both in terms of the presence of absorption peaks and changes in absorption between temperatures corresponding to the expected desorption temperature range of a given species can suggest the presence of that species. The enhancement of absorption in the 140-160 nm region and the apparent broadening of the feature centred at approximately 120 nm in most of the experiments, combined with a decrease in absorption in that region between temperatures of 140 and 200 K, is consistent with the formation and subsequent desorption of butene (C4H8; Es-sebbar et al. 2013).
As we see evidence of the formation of long carbon chains in the form of polyynes, one may reasonably wonder if such chains may close on themselves to form ringed species such as polycyclic aromatic hydrocarbons (PAHs), another class of COM relevant to astrochemistry whose members have also been detected in a wide variety of space environments (Tielens 2008; Chabot et al. 2019; McGuire et al. 2021; Burkhardt et al. 2021; Naraoka et al. 2023; Wenzel et al. 2024). However, we did not find evidence of such molecules in our spectra due to the lack of distinct absorption characteristics developing between 190 and 220 nm, which could be attributed to the known π → π* transitions associated with these species (Malloci et al. 2004; Steglich et al. 2010; James et al. 2019). The apparent non-formation of PAHs in our experiment is possibly related to steric hindrance factors that would prevent the growing sp-hybridised polyyne chain from producing a geometrical strain during any putative cyclisation reaction.
Finally, we comment on the fact that, in our post-irradiative warming experiments, the absorption bands at 200-260 nm, 265-290 nm, and 310-330 nm attributed to polyyne species were found to increase slightly upon warming up to 110 K, thus indicating the enrichment of these species within the ice (Figures 2 and 3). A similar result was reported by Cuylle et al. (2014), who suggested that thermally induced polymerisation reactions leading to CnH2 (n = 8-14) may be favourable at these temperatures. Although polyynes are known to be unstable in relation to cross-linking reactions (Springborg & Kavan 1992), this process is slow and a satisfactory reaction mechanism for this process in the condensed phase remains elusive.
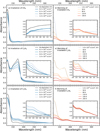 |
Fig. 2 Left panels: VUV photoabsorption spectra of 1 keV electron irradiated neat ices of (a) CH4, (b) C2H4, and (c) C2H6. Inset panels show regions of interest for molecular product identification. Right panels: VUV photoabsorption spectra of electron irradiated ices (d) CH4, (e) C2H4, and (f) C2H6 during post-irradiative warming. Inset panels show regions of interest for molecular product identification. |
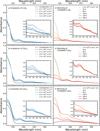 |
Fig. 3 Left panels: VUV photoabsorption spectra of 1 keV electron irradiated neat ices of (a) C3H8, (b) C6H14, and (c) C8H18. Inset panels show regions of interest for molecular product identification. Right panels: VUV photoabsorption spectra of electron irradiated ices (d) C3H8, (e) C6H14, and (f) C8H18 during post-irradiative warming. Inset panels show regions of interest for molecular product identification. |
3.2 VUV photoabsorption spectra of irradiated hydrocarbon ices mixed with N2
The VUV spectra of CH4, C2H4, and C2H6 mixed with N2 in a 1:1 dosing-line pressure ratio at 21 K, and of C3H8, C6H14, and C8H18 mixed with N2 in a 1:1 ratio at 8 K (Figures 4 and 5), are qualitatively similar to the analogous spectra of the neat hydrocarbons (Figures 2 and 3), although some blueshifting of the major hydrocarbon absorption bands by a few nanometres was observed and is likely due to an ice compositional effect, as was described earlier (Ioppolo et al. 2020, 2021; James et al. 2020, 2021). Similarly to the cases of the neat ices, an absorption feature at about 175 nm that may be attributed to the radiolytic production of C2H4 results from the 1 keV electron irradiation of the ices containing CH4, C2H6, C3H8, C6H14 and C8H18, thus highlighting the fact that the hydrocarbon-based chemistry observed in the neat ices also took place in the mixtures with N2.
Previous experimental work has demonstrated the formation of linear and cyclic structural isomers of the azidyl radical (N3) as a result of the irradiation of nitrogen-rich ices by ultraviolet photons and charged particles (Samartzis et al. 2005; Jamieson & Kaiser 2007; Ioppolo et al. 2020). Some evidence for higher-order nitrogen molecules such as azidonitrene (N4) and hexaazabenzene (N6) has also been reported in previous studies (Vogler et al. 1980; Nguyen et al. 2003). Despite this, none of our irradiations of hydrocarbon ices mixed with N2 in a 1:1 ratio exhibited absorption bands attributable to such nitrogenbased products. This is somewhat ofan unexpected result, since a previous study by Chin et al. (2016) documented the formation of N3 during the deposition of CH4:N2 (1:400) ices that were simultaneously irradiated by 0.5 keV electrons. However, it should be noted that the ultraviolet absorption features of N3 are not particularly intense (e.g. see Fig. 5 in Ioppolo et al. 2020). Comparing our previous results on the 1 keV electron irradiation of N2 in Ioppolo et al. (2020) with the ice mixtures described in the present work, the amount of N3 formed here could easily be below the detection limit because here the ice is estimated to be roughly five times thinner, the amount of available N2 is thus ten times lower, and the final fluence achieved is more than two orders of magnitude lower.
As with the irradiation of the neat hydrocarbon ices, a prominent absorption band over the 200-260 nm wavelength range associated with polyyne formation is evident in the VUV spectra of the hydrocarbon ices mixed with N2 acquired during their irradiation (Figures 4 and 5). In the spectrum of the electron irradiated CH4:N2 ice, this band is centred at 227 nm throughout the irradiation process and its absorbance grows with increasing electron fluence (Figure 4a). The band does not shift in its position during post-irradiative warming, although losses due to sublimation are recorded as the temperature of the ice is increased (Figure 4d). The spectrum of the electron-irradiated C2H4:N2 ice displays somewhat different trends, with the emergent band being centred at 225 nm (Figure 4b). As electron fluence increases, this band increases in absorbance (to a significantly greater extent than was observed in the case of CH4:N2 ice) and redshifts to 228 nm. This redshift continues to develop during post-irradiative warming, with a band peak position of 233 nm being observed at a temperature of 140 K (Figure 4e). The polyyne absorption feature observed during the irradiation of the C2H6:N2 mixed ice is centred at 231 nm and does not vary significantly in its position as the supplied electron fluence increases, although its absorbance increases to a level comparable to that of the irradiated C2H4:N2 ice (Figure 4c). During post-irradiative warming, this band exhibits a decrease in its absorbance intensity along with a very small blueshift to 230 nm (Figure 4f). In the spectrum of the C3H8:N2 ice, this feature is observed to be very weak, with a peak absorbance of 0.01 at approximately 233 nm by the end of the electron irradiation that does not appear to shift during either the irradiation or the warming (Figures 5a and 5d). The polyyne absorption feature observed during the irradiation of the C6H14:N2 mixed ice initially appears to be centred at 227 nm after the first dose of electron irradiation, and shifts to 234 nm by the final dose (Figure 5b). During post-irradiative warming, the band further redshifts to 236 nm by 140 K, then to 243 nm by 200 K (Figure 5e). In the spectrum of the electron irradiated C8H18:N2 mixed ice, the band appears to be centred at 230 nm and shifts to 234 nm by the end of the electron irradiation (Figure 5c). During post-irradiative warming, the band shifts to 236 nm by 140 K, and 240 nm by 200 K (Figure 5f).
Therefore, and as was the case with irradiation experiments involving neat hydrocarbon ices, irradiation of most of the hydrocarbon ices mixed with N2 results in the formation of the broad feature between 260 and 300 nm in acquired VUV spectra associated with polyyne synthesis. However, it is only in the spectra acquired during irradiation of the C8H18:N2 mixed ice (Figure 5c) that we can observe distinct peaks at approximately 275, 291, and 326 nm, which we, respectively, tentatively attribute to polyyne species C12H2, C14H2, and C16H2. It is worth noting that these absorption features do not vanish upon warming to room temperature, which suggests that they are at least in part attributable to large, refractory molecules. Despite this, the especially low absorbances of these features in the spectra of the electron-irradiated C8H18:N2 mixed ice make it unclear whether the positions of these peaks are shifted relative to their analogues observed in neat hydrocarbon experiments, and therefore their assignment must remain tentative.
It is worth mentioning that the composition of the ice can alter the band appearances and profiles of certain molecular species, as was previously described. Only a significant shift in the peak position or shape of the (cyano)polyyne band after the sublimation of all volatile species from the ice could be used to support the identification of (cyano)polyyne.
At this point, it is necessary to discuss the possible chemical nature of the polyynes that contribute to the broad absorption feature between 260 and 300 nm in the spectra of the electron-irradiated binary ice mixtures with N2. The chemical routes to the formation of polyynes in neat irradiated hydrocarbon ices have already been discussed in Section 3.1, and there is no reason to suggest that any of these formation pathways could not have also occurred in our irradiated binary ice mixtures with N2. However, it is also possible that cyanopolyyne formation (in which one or both of the terminal hydrogen atoms in a polyyne molecule are replaced by -CN functional moi-eties) could have occurred to some extent. In fact, previous experimental results have shown that cyanopolyynes with six to sixteen carbon atoms are efficiently formed by the reaction of nitrogen-containing molecules with elemental carbon clusters generated by laser ablation or submerged arcs (Kroto et al. 1987; Grösser & Hirsch 1993; Cataldo 2004a,b,c, 2006a,b). Although the contribution of such elemental carbon clusters to the formation of cyanopolyynes in our ice irradiation experiments is unlikely, primarily due to the need to cleave multiple covalent bonds in the parent hydrocarbon molecules, it should be noted that there is good agreement between the relative abundances of (cyano)polyynes obtained as a result of carbon arcing in various solvents and those observed in the circumstellar environments of carbon-rich stars (Cataldo 2006b).
Cyanopolyynes may also be formed through other mechanisms: in the gas phase, for example, the addition of nitrogen atoms to hydrocarbons may directly contribute to the synthesis of cyanopolyynes (Freeman & Millar 1983; Millar & Freeman 1984). However, of greater relevance to this study are the processes in which radiolytically generated radical species recombine to yield cyanopolyynes in the solid phase. A brief review of this topic can be found in the work of Kolos (2019). Based on the mechanistic elucidations provided by previous studies concerning the elongation of cyanopolyynes as a result of their irradiation by ultraviolet photons (Coupeaud et al. 2006; Crépin et al. 2011; Couturier-Tamburelli et al. 2014; Turowski et al. 2015; Szczepaniak et al. 2017, 2018), we are able to propose a synthetic pathway by which cyanopolyynes may form as a result of the electron irradiation of our hydrocarbon ices when mixed with N2. This synthesis would, of course, occur in parallel with the formation of non-nitrogen-bearing polyyne molecules.
The first step in this synthetic pathway is the radiolytic production of CN radicals in the ice, which has been previously reported in energetically processed ices that initially contained hydrocarbons mixed with N2 (Moore & Hudson 2003; Wu et al. 2012). These CN radicals may then directly react with CCH radicals present within the ice matrix as a result of the irradiation of the hydrocarbon component of the ice, thereby yielding cyanoacetylene (HC3N). This reaction has been shown to occur appreciably at various temperatures, including those relevant to interstellar space (Lichtin & Lin 1986; Herbert et al. 1992; Woon & Herbst 1997). From this point on, the extension of the molecular carbon backbone of the cyanopolyyne occurs via a radical polymerisation process involving the reaction with other CCH radicals or with radicals resulting from the dehydrogenation of higher polyynes. In principle, this process of carbon chain extension may proceed indefinitely provided that there is a sufficient supply of alkyne-derived radicals to sustain this growth. However, it should be noted that if the radical with which the growing cyanopolyyne reacts also bears a -CN functional moiety, then the resultant cyanopolyyne is one that is capped by a —CN group at both termini and that therefore cannot participate in further polymerisation reactions. This reaction network is shown in equation form as follows:
 (12)
(12)
 (13)
(13)
 (14)
(14)
 (15)
(15)
Although the VUV absorption spectra presented in Figures 4 and 5 show evidence of polyyne formation in our irradiated hydrocarbon ices containing N2 through the emergence of a band at approximately 230 nm, it is very difficult to pinpoint exactly which molecules are responsible for the appearance of this band. Moreover, it is challenging to estimate the compositional balance between cyanopolyynes and non-nitrogen-bearing polyynes. Despite this, we are able to make reasonable suggestions as to the chemical identities of the (cyano)polyynes that resulted from the irradiation of our N2-containing ices. These suggestions are based on the results of previously published studies, as well as on spectroscopic comparisons made in this present study between the polyyne bands observed after the irradiation of neat hydrocarbon ices (Figures 2 and 3) and those observed after the irradiation of the ices containing N2 (Figures 4 and 5).
The position of the emergent (cyano)polyyne band at approximately 230 nm is, at its maximum intensity during electron irradiation, blueshifted by 2-3 nm compared to the emergent polyyne band observed during the irradiation of the neat hydrocarbon ices, which indicates that there has already been a change in the chemical nature of the molecular species responsible for this absorption feature. Previous experimental and computational work has shown that polyynes with shorter carbon chains exhibit VUV absorption bands that peak at lower wavelengths and that cyanopolyynes containing n carbon atoms also exhibit blueshifted absorption band peaks compared to their analogous non-nitrogen-containing polyynes containing n + 1 carbon atoms (Eastmond et al. 1972; Kloster-Jensen et al. 1974; Haink & Jungen 1979; Ding et al. 2003; Tabata et al. 2006; Wakabayashi et al. 2007, 2012; Wada et al. 2012; Szczepaniak et al. 2020). As such, our VUV spectroscopic results suggest that the (cyano)polyynes responsible for the absorption at about 230 nm after the electron irradiation of our hydrocarbon ices mixed with solid N2 (Figures 4 and 5) have shorter carbon chains than the polyynes formed as a result of the irradiation of neat solid hydrocarbons (Figures 2 and 3); the latter has been suggested to be abundant in C8H2.
Indeed, by comparing the position of the (cyano)polyyne absorption band located at approximately 230 nm in our spectra with literature data (Shindo et al. 2003; Cataldo 2004a; Jolly & Benilan 2008; Wakabayashi et al. 2012), we have been able to find a reasonably good match with the position of the most intense absorption features in the VUV spectra of the polyyne octatetrayne (C8H2) and the cyanopolyynes cyanotriacetylene (HC7N), cyanotetraacetylene (HC9N), and hexadiyne-dinitrile (C6N2) and are therefore able to tentatively suggest that these species constitute a large fraction of the polymeric alkynes present in the irradiated ices. The absorbances of the (cyano)polyyne features at >200 nm are consistently lower in the spectra of the electron-irradiated hydrocarbon ices mixed with N2 (Figures 4 and 5) compared to those of the analogous polyyne absorption features in the spectra of the electron irradiated neat hydrocarbon ices (Figures 2 and 3); despite similar initial abundances of ice being present prior to any radiolytic processing. This is perhaps indicative of fewer long-chain products formed as a result of the irradiation of the mixed ices compared to the neat ices.
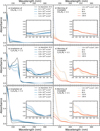 |
Fig. 4 Left panels: VUV photoabsorption spectra of 1 keV electron irradiated binary ices of (a) CH4, (b) C2H4, and (c) C2H6, mixed with N2 in a 1:1 ratio. Inset panels show regions of interest for molecular product identification. Right panels: VUV photoabsorption spectra of electron irradiated binary ices of (d) CH4, (e) C2H4, and (f) C2H6 mixed with N2 in a 1:1 ratio, during post-irradiative warming. Inset panels show regions of interest for molecular product identification. |
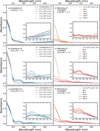 |
Fig. 5 Left panel: VUV photoabsorption spectra of 1 keV electron irradiated binary ices of (a) C3H8, (b) C6H14, and (c) C8H18 mixed with N2 in a 1:1 ratio. Inset panels show regions of interest for molecular product identification. Right panel: VUV photoabsorption spectra of electron irradiated binary ices of (d) C3H8, (e) C6H14, and (f) C8H18 mixed with N2 in a 1:1 ratio, during post-irradiative warming. Inset panels show regions of interest for molecular product identification. |
3.3 VUV photoabsorption spectra of irradiated hydrocarbon ices mixed with NH3
The pre-irradiation VUV photoabsorption spectrum of the CH4:NH3 mixed ice at 8 K (Figure 6a) exhibits a feature centred at 127 nm attributable to CH4 as well as another feature centred at 176 nm attributable to NH3 (Figure 6a; Dawes et al. 2007). We observed no features beyond 200 nm prior to electron irradiation with the exception of a small increase in absorbance towards the higher wavelength end of the spectrum, similar to that observed in the neat CH4 experiment (Figure 2a). During electron irradiation, we observe an initial small increase in, followed by a decline of, the 127 nm feature as well as a subtle blueshift to 125 nm. The 176 nm feature drops only slightly in absorbance, accompanied by a shift to 173 nm by the end of the electron irradiation. A small double-peaked feature with peaks at 225 and 235 nm was observed in the spectrum of the CH4:NH3 mixed ice after a total electron fluence of 8 × 10¹⁴ e- cm-2 had been delivered. The double peak nature of this feature disappears after the final dose of irradiation to a total fluence of 1.0 × 10¹⁵ e- cm-2, after which the feature appears as a small bump centred at 228 nm on top of a shallow slope that decreases towards longer wavelengths (Figure 7a). During post-irradiative warming (Figure 6d), the 125 nm feature is further diminished during the desorption of the CH4 by 50 K, and vanishes entirely by 110 K. The 173 nm feature redshifts to 176 nm by 50 K but blueshifts to 174 nm by 80 K, and decreases substantially after further warming. The feature at approximately 230 nm does not appear to shift during warming, but is either not present after 200 K or is masked by a broader feature between 220 and 300 nm at that temperature. A change in gradient in the CH4:NH3 mixed ice spectra at 302 nm may also be suggestive of the presence of a weak absorption feature between 260 and 302 nm during the post-irradiative warming.
The VUV photoabsorption spectrum of the C2H4:NH3 (Figure 6b) mixed ice is qualitatively similar to that of the CH4:NH3 mixed ice; however, the feature at 170 nm has a larger relative absorbance as well as a somewhat blueshifted position due to the overlapping absorptions of C2H4 and NH3. During electron irradiation, this feature decreases in absorbance without displaying a clear wavelength shift. The feature at 122 nm increases in absorbance during the irradiation, and also does not exhibit any wavelength shift. After an electron fluence of 8 × 10¹⁴ e- cm-2 had been delivered, a small absorption feature becomes visible at 230 nm. During post-irradiative warming (Figure 6e), this feature at 230 nm decreases in absorbance while redshift-ing slightly to 233 nm by 200 K. The 122 and 170 nm peaks decrease in absorbance in parallel during warming, and a series of small peaks are revealed, which vanish by 200 K. Moreover, and similar to the observations made during warming of the electron-irradiated CH4:NH3 mixed ice, a change in gradient in the absorbance at 310 nm suggests the presence of a weak absorption feature in the 250-310 nm region. The VUV photoabsorption spectrum of the C2H6:NH3 mixed ice (Figure 6c) is again similar to that of the CH4:NH3 mixed ice. The spectrum of the unirradiated C2H6:NH3 ice shows two absorption peaks, centred at 123 and 174 nm, and a broad rise in absorbance towards wavelengths >250 nm. Upon irradiation, the peak centred at 174 nm shifts to 172 nm after the first dose of radiation and remains there throughout subsequent irradiation steps. We observe a small absorption feature centred at 225 nm by the end of the electron irradiation, but no other new peaks. During postirradiative warming (Figure 6f), the peak at 225 nm initially rises in absorbance by 50 K, but decreases again by 80 K and declines to zero with further heating. The two large peaks at 123 and 174 nm also decrease in absorbance above 80 K. The >250 nm spectral region is largely flat during warming, with the broad slope gradually vanishing as the ice is heated. Other features are not clearly present.
The VUV photoabsorption spectrum of the C3H8:NH3 mixed ice (Figure 7a) features a band centred at 122 nm that does not shift its position despite increasing absorbance during electron irradiation, and another centred at 177 nm that blueshifts to 175 nm and increases in absorbance by the end of electron irradiation. A small absorption feature centred at 227 nm grows in absorbance during irradiation. During post-irradiative warming (Figure 7d), the 227 nm feature does not shift its position, but does vary its absorbance: the absorbance decreases between 8 and 50 K, increases between 50 and 80 K, and decreases thereafter until the feature is no longer clearly visible at 200 K. As with the spectra of the CH4:NH3 and C2H4:NH3 mixed ices, a change in gradient in the spectra at 300 nm during the warming suggests the presence of a shallow absorption peak between 250 and 300 nm.
The VUV photoabsorption spectrum of the C6H14:NH3 mixed ice (Figure 7b) exhibits nearly identical behaviour to that of the C3H8:NH3 mixed ice during its irradiation by 1 keV electrons. The only notable differences are that the two peaks apparent in the 150-200 nm and 200-250 nm regions are somewhat redshifted in the C6H14:NH3 ice mixture relative to the C3H8:NH3 ice mixture. For the C6H14:NH3 ice, these peaks appear centred at 177 nm and 230 nm, and are not observed to shift in absorbance during electron irradiation. During postirradiative warming (Figure 7e), the 230 nm peak does not change in wavelength position, but increases in absorbance by 110 K, after which it decreases with further heating. The VUV photoabsorption spectrum of the C8H18:NH3 mixed ice (Figure 7c) is again very similar to those of the C3H8:NH3 and C6H14:NH3 ices. The pre-irradiation spectrum at 8 K features absorption bands centred at 122 nm and 177 nm. Upon electron irradiation, the 177 nm band blueshifts subtly to 176 nm and bands at 232 and 280 nm are observed to form. During post-irradiative warming (Figure 7f), neither the 232 nm nor the 280 nm band appears to undergo position shifts, although both experience an increase in absorbance until 140 K. However, the band at 177 nm is observed to subtly blueshift during warming to 176 nm by 80 K. Conversely, the 122 nm band does not shift at all during warming. The bands at 122 and 176 nm both increase in absorbance by 110 K, but decrease in absorbance upon further warming.
As described in Section 3.2, previous experimental work has demonstrated that structural isomers of N3 and higher-order nitrogen allotropes such as N4 and N6 may be formed as a result of the irradiation of nitrogen-rich ices (Vogler et al. 1980; Nguyen et al. 2003; Samartzis et al. 2005; Jamieson & Kaiser 2007). Therefore, it is perhaps reasonable to assume that the irradiation of ices rich in NH3 should also be amenable to the formation of these products, since the N—H bonds in NH3 should be more easily cleaved than the N≡N bond in N2, allowing for the easier synthesis of nitrogen-containing radicals that could participate in radiolytic chemistry. However, as was the case with our irradiation experiments involving N2, we have again not found any evidence for the formation of higher-order nitrogen allotropes in our irradiations involving NH3. However, the chemical reactions taking place within the electron-irradiated binary ices containing NH3 are expected to be very similar to those occurring in the irradiated binary ices containing N2, with the formation of cyanopolyynes resulting from the reaction of HC3N (itself formed from the reaction between the CN and CCH radicals) with CCH radicals or other species synthesised as a result of the dehydrogenation of higher order polyynes. In fact, the only difference in the chemistry occurring in our N2-containing and NH3-containing electron-irradiated binary ices should be the mechanism by which the CN radical is initially formed.
Similarly to the spectra of the ices containing N2, the VUV spectra of the hydrocarbons mixed with NH3 exhibit some blueshifting of the main hydrocarbon absorption bands relative to their positions in the analogous spectra of neat hydrocarbon ices. This is likely due to the same ice compositional effect as that described earlier (Ioppolo et al. 2020, 2021; James et al. 2020, 2021). However, unlike the previously described results, an additional absorption feature at about 177 nm is also present in the spectra of binary ices containing NH3, which may be attributed to NH3 itself (Dawes et al. 2007). This band partially obscures the feature at approximately 175 nm that arises during electron irradiation of ices containing CH4, C2H6, C3H8, C6H14, and C8H18 and is attributed to the radiolytic synthesis of C2H4. However, a slight blueshift of this feature in each of the ices mixed with NH3 immediately after electron irradiation suggests that C2H4 synthesis and the hydrocarbon-based chemistry observed during the electron irradiation of the neat ices also occurred in binary mixtures containing NH3, as was the case for binary mixtures containing N2.
We see this similarity between the N2 and NH3-bearing experiments when attributing species to the observed peaks. The peak at approximately 230 nm that was attributed to some mixture of C8H2, HC7N, HC9N, and C6N2 in experiments involving hydrocarbon ices mixed with N2 exhibits very similar behaviour in those ices mixed with NH3, albeit at different intensity. Due to the similar behaviour of the band between the sets of experiments, we can make the same tentative assignment of this band to the (cyano)polyynes C6H2, HC7N, HC9N and C6N2. A comparison of the intensities and relative (cyano)polyyne yield is provided further below.
The spectra taken during both irradiation and warming of the NH3-bearing ices in the 240-280 nm region are again similar to those of their corresponding N2-bearing counterparts. The broad and low absorbance characteristic in this region, which persists after warming to 200 K, suggests the formation of large species. In the C8H18:N2 mixed ice, this broad feature was observed as distinct peaks that allowed the tentative assignment of polyyne species C12H2 and C14H2. However, like in the rest of the N2-bearing experiments, no such individual features are clearly observed in the experiments involving hydrocarbon ices mixed with NH3. The broad, low-absorbance 240-280 nm feature is likely due to a mixture of refractory species for which we are unable to make specific assignments.
It should also be noted that the spectra acquired during the irradiation of hydrocarbons mixed with NH3 were largely devoid of absorption features at wavelengths >300 nm, suggesting that long-chain (cyano)polyynes (i.e. those molecules that have 16 or more carbon atoms) probably did not form during these irradiation experiments. This is in line with our tentative assignments of the actual (cyano)polyynes formed during these experiments, of which the largest was HC9N.
As with all previously described experimental spectra, we observe a large absorbance feature at the low-wavelength end (120 nm) of the spectra of hydrocarbon ices mixed with NH3, which evolves slightly both during irradiation and postirradiative warming. Furthermore, as with previous experiments, this region is characteristic of a wide variety of species, notably alkanes. We expect that alkanes other than the deposited alkane species may have formed from the fragmentation of the deposited alkane species, but we cannot individually identify them using VUV photoabsorption spectroscopy alone.
It is possible to compare the relative yields of (cyano)polyynes obtained as a result of irradiating 1:1 binary ices of various hydrocarbons mixed with N2 versus NH3. Comparing the spectra shown in Figures 4 and 5 with those shown in Figures 6 and 7, it is possible to note that the absorption bands at approximately 230 nm associated with the polyyne C6H2 and cyanopolyynes HC7N, HC9N, and C6N2 are generally more pronounced in experiments with NH3 compared to those using N2 as their nitrogen source; despite the similar initial abundances of nitrogen source molecules across all experiments. This suggests that (cyano)polyyne formation is more efficient if the initial nitrogen-source molecule in the binary mixture is NH3 rather than N2, which is proportionate to the weaker bond strength of the N-H bond compared to the N≡N bond, which would therefore allow for the easier formation of nitrogen-bearing radicals from the former molecule than from the latter molecule. The notable exception to this observation is the C2H6:NH3 irradiation experiment, for which very little absorbance was observed in the 200-250 nm region (Figure 6c), indicating a generally inefficient synthesis of (cyano)polyynes with 7-10 carbon atoms compared to the analogous experiment using N2. The 250-300 nm region appears similar between the experiments with N2 and NH3 in that it shows a broad feature with low absorbance. This suggests that few long-chain (>10 carbon atoms) products are formed in either of these sets of experiments.
Finally, we wish to draw attention to the fact that our postirradiative warming experiments demonstrated greater losses in absorbance at wavelengths <200 nm across the 110 to 140 K temperature range for the irradiated hydrocarbon ices mixed with NH3 compared to those mixed with N2. This observation is particularly interesting, as it is in line with the hypothesised sublimation of methylamine (CH3NH2), which is known to exhibit broad absorption bands at wavelengths <200 nm (Holtom et al. 2007) and is expected to desorb over this same temperature range under laboratory astrochemistry conditions (Förstel et al. 2017; Chaabouni et al. 2018). Therefore, we tentatively identify the formation of CH3NH2 in the mixed ice experiments containing NH3, with the exception of the CH4:NH3 experiment, where the change in absorbance between 110 and 140 K at <200 nm was minimal. This result may be of particular interest to the astrobiology research community, as it is good evidence that multiple families of precursors to biologically relevant amino acids (i.e. cyanopolyynes and amines) may be formed as a result of the irradiation of hydrocarbons mixed with NH3.
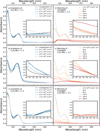 |
Fig. 6 Left panels: VUV photoabsorption spectra of 1 keV electron irradiated binary ices of (a) CH4, (b) C2H4, and (c) C2H6, mixed with NH3 in a 1:1 ratio. Inset panels show regions of interest for molecular product identification. Right panels: VUV photoabsorption spectra of electron irradiated binary ices of (d) CH4, (e) C2H4, and (f) C2H6 mixed with NH3 in a 1:1 ratio, during post-irradiative warming. Inset panels show regions of interest for molecular product identification. |
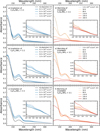 |
Fig. 7 Left panels: VUV photoabsorption spectra of 1 keV electron irradiated binary ices of (a) C3H8, (b) C6H14, and (c) C8H18 mixed with NH3 in a 1:1 ratio. Inset panels show regions of interest for molecular product identification. Right panels: VUV photoabsorption spectra of electron irradiated binary ices of (d) C3H8, (e) C6H14, and (f) C8H18 mixed with NH3 in a 1:1 ratio, during post-irradiative warming. Inset panels show regions of interest for molecular product identification. |
Summary of radiolytic product absorption band positions identified after the electron irradiation of hydrocarbon-rich ices.
3.4 Summary of results
In this article, we have presented a detailed VUV spectroscopic study of the formation of (cyano)polyynes as a result of the 1 keV electron irradiation of various hydrocarbons either as neat ices or in 1:1 binary mixtures with N2 or NH3. Our description of the experimental results presented in Sections 3.1-3.3 is fairly lengthy, and includes detailed information on the wavelength position of emergent bands attributable to the radiolytic formation of products as well as their relative shifting during post-irradiative warming of the ice. In an effort to present our results more clearly, we have compiled a summary of this data, which is presented in Table 2 and which, it is hoped, will allow the interested reader to locate quantitative information with greater ease.
4 Astrophysical implications
Molecules composed of carbon chains are an important and relatively ubiquitous component of interstellar and circumstellar environments, where they comprise more than 40% of the molecular species detected (Taniguchi et al. 2024). In particular, polyynes and related species such as cyanopolyynes and methylpolyynes have been detected in a number of different environments, including pre-stellar cores (Cordiner et al. 2011; Bianchi et al. 2023), photodissociation regions (Cuadrado et al. 2015), star-forming regions (Cordiner et al. 2011; Wang et al. 2022; Al-Edhari et al. 2017), the outer envelopes of carbon-rich stars (Cherchneff et al. 1993; Cernicharo 2004; Pardo et al. 2022), protoplanetary nebulae (Pardo et al. 2005), and even extragalactic sources (Martin et al. 2021). The detection of (cyano)polyynes in the Taurus Molecular Cloud (TMC-1) is particularly noteworthy due to the fact that it is known to host a large number of COMs (Freeman & Millar 1983; Soma et al. 2018; McCarthy et al. 2021; Cooke et al. 2023; Wenzel et al. 2024). In fact, polyynes as large as the decapentaynylide ion (C10H-), cyanopolyynes as large as HC9N, methylpolyynes as large as methyltriacetylene (CH3C6H), and methylcyanopolyynes as large as methylcyanotriacetylene (CH3C7N) have been detected in TMC-1 (Remijan et al. 2006, 2023; Loomis et al. 2016; Siebert et al. 2022).
Typically, it has been assumed that the formation of (cyano)polyynes in dense molecular clouds such as TMC-1 is mediated by simple gas-phase reactions in which carbon atoms are added to the growing chain (Winnewisser & Walmsley 1979; Bujarrabal et al. 1981; Fukuzawa et al. 1998). However, the low temperatures (i.e. 10-20 K) in the cold cores of dense molecular clouds allow for the formation of an ice layer that is adsorbed on the surfaces of interstellar dust grains. Among the most common species in these interstellar ices are CH4 and NH3 (Öberg 2016); some of the same molecules that were considered in the present study. Our VUV spectroscopic results have shown that the irradiation of neat hydrocarbon ices, as well as binary mixtures with N2 and NH3, leads to the formation of (cyano)polyynes. In the context of interstellar astrochemistry, these results demonstrate that solid-phase radiation chemistry triggered by, for instance, galactic cosmic rays may contribute to the presence of the (cyano)polyynes observed in dense molecular clouds such as TMC-1, in addition to the gas-phase reactions outlined earlier. This interpretation is in line with the hypothesised role of interstellar ices as the primary source of COMs.
Within our own Solar System, a number of outer bodies are known to possess icy surfaces rich in hydrocarbons and nitrogenbearing species, and perhaps the most relevant of these bodies to our present study are Pluto and its largest moon Charon. The surface of Pluto is dominated by N2 ice, with smaller quantities of CH4 and CO also present; conversely, the surface ices of Charon are dominated by H2O together with NH3 hydrates (Cruikshank et al. 2015; Pavithraa et al. 2018). Interestingly, previous computational studies have determined that mass transfer of N2 and CH4 from Pluto to Charon is an efficient process, and may result in the deposition of at least a few micrometres of ice at the Charonian poles during the winter, during which time surface temperatures drop to 10-30 K (Tucker et al. 2015; Hoey et al. 2017).
Recent work by Raut et al. (2022) has shown that the deposition of CH4 from Pluto at the north pole of Charon during winter may be a major contributor to the reddish colouration of this region (Stern et al. 2015; Grundy et al. 2016). It has been proposed that the irradiation of CH4 ice at the northern Charonian pole as a result of its interaction with energetic particles derived from the solar wind and ultraviolet photons leads to the formation of solid C2H6 (Raut et al. 2022). This C2H6 is expected to be colourless (Khare et al. 1990), and so does not in itself contribute to the reddening of the Charonian pole. As temperatures begin to rise to about 60 K as winter ends, volatiles including CH4 and C2H6 undergo sublimation. However, the time required for the Charonian poles to warm from 10 to 60 K is about 30 Earth years (Raut et al. 2022), thus providing ample time for the C2H6 radiolytic product to be processed by solar wind particles and ultraviolet photons. Previous laboratory experiments on the irradiation of C2H6 have demonstrated that several carbon-rich and tholin-like COMs may be formed, including unsaturated carbon chains and carbon nanotubes (Strazzulla et al. 2002; Kim et al. 2010; De Barros et al. 2016; Lo et al. 2021). These COMs are refractory in nature and therefore would resist sublimation and persist at the Charonian polar surface even as temperatures increased, thus contributing to the reddening of this region (Grundy et al. 2016; Cruikshank et al. 2020; Raut et al. 2022).
Our present experiments have demonstrated that the irradiation of ices simulating material transferred from the surface of Pluto and deposited at the northern Charonian pole results in the formation of (cyano)polyynes, which largely persist on our MgF2 substrate upon warming to higher temperatures. As such, it is likely that such (cyano)polyynes are also radiolytically produced on Charon and persist at its northern pole as seasonal temperatures increase. The question that naturally arises is therefore whether these (cyano)polyynes could, at least partly, contribute to the observed reddening of the northern Charo-nian pole. In our present study, we have proposed that the (cyano)polyynes produced as a result of our irradiations are C6H2, C8H2, C10H2, HC7N, HC9N and C6N2; with speculative detections of C12H2, C14H2, and C16H2 in some experiments also being made. Prior spectroscopic characterisation of these (cyano)polyynes has shown that their maximum absorptions all occur in the ultraviolet range (Cataldo 2004a,d), and so they would not be expected to contribute to the reddening observed on Charon. However, it is possible to speculate that the use of higher irradiation doses in our experiments could have yielded higher abundances of longer chain (cyano)polyynes, which are known to absorb light at longer wavelengths (Jolly & Benilan 2008; Chalifoux & Tykwinski 2010). If this absorption were tobe in the blue region of visible light, then this would impart a red colour to the (cyano)polyynes, as per complementary colour theory. As such, it is at least technically plausible that long irradiation times at the northern pole of Charon result in the synthesis of long-chain (cyano)polyynes, which could at least partly contribute to the red colour observed.
5 Conclusions
In this study, we have presented new VUV photoabsorption spectra of the hydrocarbons CH4, C2H4, C2H6, C3H8, C6H14, and C8H18 as neat ices, as well as in 1:1 binary mixtures with N2 and NH3, exposed to 1 keV electrons under conditions relevant to the dense interstellar medium and icy outer Solar System bodies. In the following, we list the main findings of this work.
The 1 keV electron irradiation of neat hydrocarbon ices leads to the formation of polyynes, as was determined by their VUV photoabsorption features. We have proposed that absorption features between 200 and 260 nm can be attributed to octatetrayne (C8H2) and decapentayne (C10H2), while weak absorption features beyond 260 nm are tentatively assigned to the larger polyynes dodecahexayne (C12H2), tetradecaheptayne (C14H2), and hexadecaoctayne (C16H2).
The 1 keV electron irradiation of binary hydrocarbon ices with N2 or NH3 leads to the formation of cyanopolyynes, as well as non-nitrogen-bearing polyynes, albeit in lower abundances than those formed as a result of the irradiation of neat hydrocarbon ices. Shifts in the positions of the VUV absorption bands observed after the irradiation of the N2-containing ices relative to those observed after the irradiation of the neat ices allowed us to propose that polyyne hexatriyne (C6H2) and the cyanopolyynes cyanotriacetylene (HC7N), cyanotetraacetylene (HC9N), and hexadiynedinitrile (C6N2) as radiolytic products. Furthermore, weak photoabsorption signatures observed in the spectra of the irradiated C8H18:N2 mixed ice, but not in the spectra of the irradiated C8H18:NH3 mixed ice, are tentatively assigned to the polyynes C12H2, C14H2, and C16H2.
Interestingly, the photoabsorption features associated with (cyano)polyynes were more intense in the spectra of irradiated binary ices involving NH3 compared to those involving N2, likely due to the easier cleaving of the covalent bonds to yield reactive nitrogen-containing radicals in the former compared to the latter. In addition, irradiation experiments of binary ice mixtures containing NH3 also appeared to yield CH3NH2 as a product.
In conclusion, we have provided a systematically acquired set of VUV spectra that may be used to support the future identification of (cyano)polyynes in mixed irradiated ices in space environments. Our experiments provide strong evidence that (cyano)polyynes were efficiently formed in the solid phase in hydrocarbon- and nitrogen-rich ices, such as those that may exist in dense interstellar clouds or on the surfaces of certain outer Solar System bodies such as the Pluto-Charon system.
Data availability
Data for this article are available in the Zenodo database: https://doi.org/10.5281/zenodo.15736162
Acknowledgements
The authors thank Marcel Mudrich, Bhalamurugan Sivaraman, and the Physical Research Laboratory in Ahmedabad, India, for providing key experimental components. This project has been supported through the CALIPSOplus project, which has been funded by the EU Horizon 2020 RI programme (grant agreement No. 730872). The research of ZK is supported by the Slovak Grant Agency for Science (grant No. 2/0059/22) and the COST actions TD1308 and CM1401. LEB, AMW, MP, AC, LH, and SI acknowledge support from the Danish National Research Foundation through the Centre of Excellence ‘InterCat’ (grant agreement No. DNRF150). DVM gratefully acknowledges the support of the COST Action CA20129. ATM thanks Queen Mary University of London for a doctoral scholarship. NJM appreciates the support of the Europlanet 2024 RI which has been funded by the EU Horizon 2020 Research Innovation programme (grant agreement No. 871149). GS acknowledges support from the Italian Space Agency (ASI 2013-056 JUICE Partecipazione Italiana alla fase A/B1) and from COST action TD1308.
References
- Abplanalp, M. J., & Kaiser, R. I. 2017, ApJ, 836, 195 [NASA ADS] [CrossRef] [Google Scholar]
- Abplanalp, M. J., Jones, B. M., & Kaiser, R. I. 2018, Phys. Chem. Chem. Phys., 20, 5435 [Google Scholar]
- Al-Edhari, A. J., Ceccarelli, C., Kahane, C., et al. 2017, A&A, 597, A40 [NASA ADS] [CrossRef] [EDP Sciences] [Google Scholar]
- Balucani, N., & Kaiser, R. I. 2005, Polyynes: Synthesis, Properties, and Applications (Boca Raton, USA: Taylor & Francis Group), 285 [Google Scholar]
- Becker, T. M., Trumbo, S. K., Molyneux, P. M., et al. 2022, PSJ, 3, 129 [Google Scholar]
- Bennett, C. J., Jamieson, C. S., Osamura, Y., & Kaiser, R. I. 2006, ApJ, 653, 792 [Google Scholar]
- Bianchi, E., Remijan, A., Codella, C., et al. 2023, ApJ, 944, 208 [NASA ADS] [CrossRef] [Google Scholar]
- Boyd, R. J., Jones, W. E., & Ling, K. W. 1981, Chem. Phys., 58, 203 [Google Scholar]
- Bujarrabal, V., Guélin, M., Morris, M., & Thaddeus, P. 1981, A&A, 99, 239 [NASA ADS] [Google Scholar]
- Burkhardt, A. M., Lee, K. L. K., Changala, P. B., et al. 2021, ApJ, 913, L18 [Google Scholar]
- Cataldo, F. 2004a, Tetrahedron, 60, 4265 [Google Scholar]
- Cataldo, F. 2004b, Polyhedron, 23, 1889 [Google Scholar]
- Cataldo, F. 2004c, Int. J. Astrobiol., 3, 237 [Google Scholar]
- Cataldo, F. 2004d, Carbon, 42, 129 [Google Scholar]
- Cataldo, F. 2006a, Int. J. Astrobiol., 5, 37 [Google Scholar]
- Cataldo, F. 2006b, Orig. Life Evol. Biosph., 36, 467 [Google Scholar]
- Cernicharo, J. 2004, ApJ, 608, L41 [Google Scholar]
- Chaabouni, H., Diana, S., Nguyen, T., & Dulieu, F. 2018, A&A, 612, A47 [NASA ADS] [CrossRef] [EDP Sciences] [Google Scholar]
- Chabot, M., Béroff, K., Dartois, E., Pino, T., & Godard, M. 2019, ApJ, 888, 17 [NASA ADS] [CrossRef] [Google Scholar]
- Chalifoux, W. A., & Tykwinski, R. R. 2010, Nat. Chem., 2, 967 [NASA ADS] [CrossRef] [Google Scholar]
- Cherchneff, I., Glassgold, A. E., & Mamon, G. A. 1993, ApJ, 410, 188 [NASA ADS] [CrossRef] [Google Scholar]
- Chin, C.-H., Chen, S.-C., Liu, M.-C., Huang, T.-P., & Wu, Y.-J. 2016, ApJSS, 224, 17 [Google Scholar]
- Compagnini, G., D’Urso, L., Puglisi, O., Baratta, G., & Strazzulla, G. 2009, Carbon, 47, 1605 [Google Scholar]
- Cooke, I. R., Xue, C., Changala, P. B., et al. 2023, ApJ, 948, 133 [Google Scholar]
- Cordiner, M. A., Charnley, S. B., Buckle, J. V., Walsh, C., & Millar, T. J. 2011, ApJ, 730, L18 [NASA ADS] [CrossRef] [Google Scholar]
- Coupeaud, A., Kolos, R., Couturier-Tamburelli, I., Aycard, J. P., & Piétri, N. 2006, J. Phys. Chem. A, 110, 2371 [Google Scholar]
- Couturier-Tamburelli, I., Piétri, N., Crépin, C., et al. 2014, J. Chem. Phys., 140, 044329 [NASA ADS] [CrossRef] [Google Scholar]
- Crépin, C., Turowski, M., Ceponkus, J., et al. 2011, Phys. Chem. Chem. Phys., 13, 16780 [Google Scholar]
- Cruikshank, D., Grundy, W., DeMeo, F., et al. 2015, Icarus, 246, 82 [Google Scholar]
- Cruikshank, D. P., Pendleton, Y. J., & Grundy, W. M. 2020, Life, 10, 126 [NASA ADS] [CrossRef] [Google Scholar]
- Cuadrado, S., Goicoechea, J. R., Pilleri, P., et al. 2015, A&A, 575, A82 [NASA ADS] [CrossRef] [EDP Sciences] [Google Scholar]
- Cuppen, H. M., Linnartz, H., & Ioppolo, S. 2024, Annu. Rev. Astron. Astrophys., 62, 243 [Google Scholar]
- Cuylle, S. H., Zhao, D., Strazzulla, G., & Linnartz, H. 2014, A&A, 570, A83 [NASA ADS] [CrossRef] [EDP Sciences] [Google Scholar]
- Dawes, A., Mukerji, R. J., Davis, M. P., et al. 2007, J. Chem. Phys., 126, 244711 [Google Scholar]
- De Barros, A., da Silveira, E., Fulvio, D., Rothard, H., & Boduch, P. 2016, ApJ, 824, 81 [Google Scholar]
- Ding, H., Schmidt, T. W., Pino, T., Güthe, F., & Maier, J. P. 2003, Phys. Chem. Chem. Phys., 5, 4772 [Google Scholar]
- Drouin, D., Couture, A. R., Joly, D., et al. 2007, Scanning, 29, 92 [CrossRef] [PubMed] [Google Scholar]
- Eastmond, R., Johnson, T., & Walton, D. 1972, Tetrahedron, 28, 4601 [Google Scholar]
- Eden, S., Limão-Vieira, P., Hoffmann, S., & Mason, N. 2006, Chem. Phys., 323, 313 [CrossRef] [Google Scholar]
- Es-sebbar, E.-t., Benilan, Y., & Farooq, A. 2013, J. Quant. Spectrosc. Radiat. Transf., 115, 1 [Google Scholar]
- Fayolle, M., Quirico, E., Schmitt, B., et al. 2021, Icarus, 367, 114574 [Google Scholar]
- Fedoseev, G., Li, X., Baratta, G., Palumbo, M., & Chuang, K.-J. 2025, A&A, 693, A277 [NASA ADS] [CrossRef] [EDP Sciences] [Google Scholar]
- Ferini, G., Baratta, G., & Palumbo, M. 2004, A&A, 414, 757 [NASA ADS] [CrossRef] [EDP Sciences] [Google Scholar]
- Förstel, M., Bergantini, A., Maksyutenko, P., Góbi, S., & Kaiser, R. I. 2017, ApJ, 845, 83 [Google Scholar]
- Freeman, A., & Millar, T. 1983, Nature, 301, 402 [Google Scholar]
- Fukuzawa, K., Osamura, Y., & Schaefer III, H. F. 1998, ApJ, 505, 278 [NASA ADS] [CrossRef] [Google Scholar]
- Gerakines, P. A., & Hudson, R. L. 2015, ApJ, 805, 5 [Google Scholar]
- Goodman, A. M. 1978, Appl. Opt., 17, 2779 [NASA ADS] [CrossRef] [Google Scholar]
- Grundy, W., Cruikshank, D., Gladstone, G., et al. 2016, Nature, 539, 65 [Google Scholar]
- Grösser, T., & Hirsch, A. 1993, Angew. Chem. Int. Ed., 32, 1340 [Google Scholar]
- Gudipati, M. S., Jacovi, R., Couturier-Tamburelli, I., Lignell, A., & Allen, M. 2013, Nat. Commun., 4, 1648 [NASA ADS] [CrossRef] [Google Scholar]
- Haink, H.-J., & Jungen, M. 1979, Chem. Phys. Lett., 61, 319 [Google Scholar]
- Hanel, R., Conrath, B., Flasar, F. M., et al. 1981, Science, 212, 192 [Google Scholar]
- Hendrix, A. R., Cassidy, T. A., Johnson, R. E., Paranicas, C., & Carlson, R. W. 2011, Icarus, 212, 736 [Google Scholar]
- Herbert, L., Smith, I. W. M., & Spencer-smith, R. D. 1992, Int. J. Chem. Kinet., 24, 791 [Google Scholar]
- Hoey, W. A., Yeoh, S. K., Trafton, L. M., Goldstein, D. B., & Varghese, P. L. 2017, Icarus, 287, 87 [Google Scholar]
- Holtom, P., Dawes, A., Davis, M., et al. 2007, Radiat. Phys. Chem., 76, 745 [Google Scholar]
- Hudson, R. L., Yarnall, Y. Y., Gerakines, P. A., & Coones, R. T. 2021, Icarus, 354, 114033 [NASA ADS] [CrossRef] [Google Scholar]
- Ioppolo, S., McGuire, B. A., Allodi, M. A., & Blake, G. A. 2014, Faraday Discuss., 168, 461 [NASA ADS] [CrossRef] [Google Scholar]
- Ioppolo, S., Kaňuchová, Z., James, R. L., et al. 2020, A&A, 641, A154 [NASA ADS] [CrossRef] [EDP Sciences] [Google Scholar]
- Ioppolo, S., Kaňuchová, Z., James, R. L., et al. 2021, A&A, 646, A172 [NASA ADS] [CrossRef] [EDP Sciences] [Google Scholar]
- James, R. L., Jones, N. C., Hoffmann, S. V., & Dawes, A. 2019, RSC Adv., 9, 5453 [Google Scholar]
- James, R. L., Ioppolo, S., Hoffmann, S. V., et al. 2020, RSC Adv., 10, 37515 [NASA ADS] [CrossRef] [Google Scholar]
- James, R. L., Ioppolo, S., Hoffmann, S. V., et al. 2021, RSC Adv., 11, 33055 [NASA ADS] [CrossRef] [Google Scholar]
- Jamieson, C. S., & Kaiser, R. I. 2007, Chem. Phys. Lett., 440, 98 [NASA ADS] [CrossRef] [Google Scholar]
- Jolly, A., & Benilan, Y. 2008, J. Quant. Spectrosc. Radiat. Transf., 109, 963 [Google Scholar]
- Jørgensen, J. K., Belloche, A., & Garrod, R. T. 2020, Annu. Rev. Astron. Astrophys., 58, 727 [Google Scholar]
- Khare, B. N., Thompson, W. R., Sagan, C., Arakawa, E. T., & Lawn, J. J. 1990, BAAS, 22, 1033 [Google Scholar]
- Kim, Y., Bennett, C., Chen, L.-H., O’Brien, K., & Kaiser, R. 2010, ApJ, 711, 744 [NASA ADS] [CrossRef] [Google Scholar]
- Kloster-Jensen, E., Haink, H.-J., & Christen, H. 1974, Helv. Chim. Acta, 57, 1731 [CrossRef] [Google Scholar]
- Kolos, R. 2019, Low Temp. Phys., 45, 583 [Google Scholar]
- Krasnopolsky, V. A. 2001, Icarus, 153, 277 [Google Scholar]
- Kroto, H. W., Heath, J. R., Obrien, S. C., Curl, R. F., & Smalley, R. E. 1987, ApJ, 314, 352 [Google Scholar]
- Kunde, V. G., Aikin, A. C., Hanel, R. A., et al. 1981, Nature, 292, 686 [NASA ADS] [CrossRef] [Google Scholar]
- Lichtin, D., & Lin, M. 1986, Chem. Phys., 104, 325 [Google Scholar]
- Lo, J.-I., Lu, H.-C., Peng, Y.-C., Chou, S.-L., & Cheng, B.-M. 2021, MNRAS, 508, 1056 [Google Scholar]
- Loomis, R. A., Shingledecker, C. N., Langston, G., et al. 2016, MNRAS, 463, 4175 [NASA ADS] [CrossRef] [Google Scholar]
- Luna, R., Satorre, M., Domingo, M., Millán, C., & Santonja, C. 2012, Icarus, 221, 186 [CrossRef] [Google Scholar]
- Malloci, G., Mulas, G., & Joblin, C. 2004, A&A, 426, 105 [CrossRef] [EDP Sciences] [Google Scholar]
- Marten, A., Hidayat, T., Biraud, Y., & Moreno, R. 2002, Icarus, 158, 532 [NASA ADS] [CrossRef] [Google Scholar]
- Martin, S., Mangum, J., Harada, N., et al. 2021, A&A, 656, A46 [NASA ADS] [CrossRef] [EDP Sciences] [Google Scholar]
- McCarthy, M. C., Lee, K. L. K., Loomis, R. A., et al. 2021, Nat. Astron., 5, 176 [Google Scholar]
- McGuire, B. A., Loomis, R. A., Burkhardt, A. M., et al. 2021, Science, 371, 1265 [Google Scholar]
- Mifsud, D. V., Hailey, P. A., Traspas Muiña, A., et al. 2021, Front. Astron. Space Sci., 8, 757619 [CrossRef] [Google Scholar]
- Mifsud, D. V., Kaňuchová, Z., loppolo, S., et al. 2022, J. Mol. Spectrosc., 385, 111599 [Google Scholar]
- Migliorini, A., Kanuchova, Z., Ioppolo, S., et al. 2022, Icarus, 383, 115074 [Google Scholar]
- Millar, T. J., & Freeman, A. 1984, MNRAS, 207, 405 [NASA ADS] [Google Scholar]
- Moore, M., & Hudson, R. 2003, Icarus, 161, 486 [NASA ADS] [CrossRef] [Google Scholar]
- Naraoka, H., Takano, Y., Dworkin, J. P., et al. 2023, Science, 379, eabn9033 [CrossRef] [Google Scholar]
- Nguyen, M. T., Nguyen, T. L., Mebel, A. M., & Flammang, R. 2003, J. Phys. Chem. A, 107, 5452 [Google Scholar]
- Öberg, K. I. 2016, Chem. Rev., 116, 9631 [Google Scholar]
- Palmer, M. H., Ridley, T., Hoffmann, S. V., et al. 2015, J. Chem. Phys., 142, 134302 [CrossRef] [Google Scholar]
- Pardo, J. R., Cernicharo, J., & Goicoechea, J. R. 2005, ApJ, 628, 275 [NASA ADS] [CrossRef] [Google Scholar]
- Pardo, J. R., Cernicharo, J., Tercero, B., et al. 2022, A&A, 658, A39 [NASA ADS] [CrossRef] [EDP Sciences] [Google Scholar]
- Pavithraa, S., Lo, J.-I., Rahul, K., et al. 2018, Spectrochim. Acta A, 190, 172 [Google Scholar]
- Pavithraa, S., Lo, J.-I., Cheng, B.-M., et al. 2019, Spectrochim. Acta A, 215, 130 [NASA ADS] [CrossRef] [Google Scholar]
- Prenzel, D., Kirschbaum, R. W., Chalifoux, W. A., et al. 2017, Org. Chem. Front., 4, 668 [Google Scholar]
- Puglisi, O., Compagnini, G., D’Urso, L., et al. 2014, Nucl. Instrum. Methods Phys. Res. B, 326, 2 [Google Scholar]
- Ramachandran, R., Meka, J., Rahul, K., et al. 2024, Icarus, 410, 115896 [Google Scholar]
- Ramadhan, A., Wesolowski, M., Wakabayashi, T., et al. 2017, Carbon, 118, 680 [Google Scholar]
- Raut, U., Teolis, B. D., Kammer, J. A., et al. 2022, Sci. Adv., 8, eabq5701 [Google Scholar]
- Remijan, A. J., Hollis, J., Snyder, L., Jewell, P., & Lovas, F. 2006, ApJ, 643, L37 [NASA ADS] [CrossRef] [Google Scholar]
- Remijan, A., Scolati, H. N., Burkhardt, A. M., et al. 2023, ApJ, 944, L45 [NASA ADS] [CrossRef] [Google Scholar]
- Samartzis, P. C., Lin, Jr., J.-M., Ching, T.-T., et al. 2005, J. Chem. Phys., 123, 051101 [Google Scholar]
- Sandford, S. A., Nuevo, M., Bera, P. P., & Lee, T. J. 2020, Chem. Rev., 120, 4616 [NASA ADS] [CrossRef] [Google Scholar]
- Satorre, M., Domingo, M., Millán, C., et al. 2008, Planet. Space Sci., 56, 1748 [NASA ADS] [CrossRef] [Google Scholar]
- Satorre, M., Leliwa-Kopystynski, J., Santonja, C., & Luna, R. 2013, Icarus, 225, 703 [NASA ADS] [CrossRef] [Google Scholar]
- Satorre, M., Millán, C., Molpeceres, G., et al. 2017, Icarus, 296, 179 [Google Scholar]
- Shindo, F., Benilan, Y., Guillemin, J.-C., et al. 2003, Planet. Space Sci., 51, 9 [NASA ADS] [CrossRef] [Google Scholar]
- Siebert, M. A., Lee, K. L. K., Remijan, A. J., et al. 2022, ApJ, 924, 21 [CrossRef] [Google Scholar]
- Soma, T., Sakai, N., Watanabe, Y., & Yamamoto, S. 2018, ApJ, 854, 116 [Google Scholar]
- Springborg, M., & Kavan, L. 1992, Chem. Phys., 168, 249 [Google Scholar]
- Steglich, M., Jäger, C., Rouillé, G., et al. 2010, ApJ, 712, L16 [NASA ADS] [CrossRef] [Google Scholar]
- Stern, S. A., Bagenal, F., Ennico, K., et al. 2015, Science, 350, aad1815 [Google Scholar]
- Strazzulla, G., Baratta, G., Domingo, M., & Satorre, M. 2002, Nucl. Instrum. Methods Phys. Res. B, 191, 714 [Google Scholar]
- Szczepaniak, U., Kolos, R., Gronowski, M., et al. 2017, J. Phys. Chem. A, 121, 7374 [Google Scholar]
- Szczepaniak, U., Kolos, R., Gronowski, M., et al. 2018, J. Phys. Chem. A, 122, 5580 [Google Scholar]
- Szczepaniak, U., Ozaki, K., Tanaka, K., et al. 2020, J. Mol. Struct., 1214, 128201 [Google Scholar]
- Tabata, H., Fujii, M., Hayashi, S., Doi, T., & Wakabayashi, T. 2006, Carbon, 44, 3168 [Google Scholar]
- Taniguchi, K., Gorai, P., & Tan, J. C. 2024, Astrophys. Space Sci., 369, 34 [Google Scholar]
- Thombre, R., Gupta, D., Pavithraa, S., et al. 2022, Eur. Phys. J. D, 76, 53 [Google Scholar]
- Tielens, A. 2008, Annu. Rev. Astron. Astrophys., 46, 289 [CrossRef] [Google Scholar]
- Tucker, O. J., Johnson, R. E., & Young, L. A. 2015, Icarus, 246, 291 [Google Scholar]
- Turowski, M., Crépin, C., Douin, S., & Kolos, R. 2015, J. Phys. Chem. A, 119, 2701 [Google Scholar]
- Vogler, A., Wright, R. E., & Kunkely, H. 1980, Angew. Chem. Int. Ed., 19, 717 [Google Scholar]
- Wada, Y., Morisawa, Y., & Wakabayashi, T. 2012, Chem. Phys. Lett., 541, 54 [Google Scholar]
- Wakabayashi, T., Nagayama, H., Daigoku, K., Kiyooka, Y., & Hashimoto, K. 2007, Chem. Phys. Lett., 446, 65 [Google Scholar]
- Wakabayashi, T., Saikawa, M., Wada, Y., & Minematsu, T. 2012, Carbon, 50, 47 [Google Scholar]
- Wang, Y. X., Zhang, J. S., Yan, Y. T., et al. 2022, A&A, 663, A177 [NASA ADS] [CrossRef] [EDP Sciences] [Google Scholar]
- Wenzel, G., Cooke, I. R., Changala, P. B., et al. 2024, Science, 386, 810 [NASA ADS] [CrossRef] [Google Scholar]
- Winnewisser, G., & Walmsley, C. 1979, Astrophys. Space Sci., 65, 83 [Google Scholar]
- Woon, D. E., & Herbst, E. 1997, ApJ, 477, 204 [Google Scholar]
- Wu, Y.-J., Wu, C. Y. R., Chou, S.-L., et al. 2012, ApJ, 746, 175 [NASA ADS] [CrossRef] [Google Scholar]
- Zhang, J., Muina, A. T., Mifsud, D. V., et al. 2024, MNRAS, 533, 826 [NASA ADS] [CrossRef] [Google Scholar]
- Zhao, J., Zhang, Y., Fang, Y., et al. 2017, Chem. Phys. Lett., 682, 96 [Google Scholar]
All Tables
Summary of radiolytic product absorption band positions identified after the electron irradiation of hydrocarbon-rich ices.
All Figures
|
Fig. 1 Results of CASINO simulations showing the percentage of incident electrons implanted into the ices as a function of penetration depth. Each simulation considered the trajectories of 1000 electrons. |
| In the text | |
|
Fig. 2 Left panels: VUV photoabsorption spectra of 1 keV electron irradiated neat ices of (a) CH4, (b) C2H4, and (c) C2H6. Inset panels show regions of interest for molecular product identification. Right panels: VUV photoabsorption spectra of electron irradiated ices (d) CH4, (e) C2H4, and (f) C2H6 during post-irradiative warming. Inset panels show regions of interest for molecular product identification. |
| In the text | |
|
Fig. 3 Left panels: VUV photoabsorption spectra of 1 keV electron irradiated neat ices of (a) C3H8, (b) C6H14, and (c) C8H18. Inset panels show regions of interest for molecular product identification. Right panels: VUV photoabsorption spectra of electron irradiated ices (d) C3H8, (e) C6H14, and (f) C8H18 during post-irradiative warming. Inset panels show regions of interest for molecular product identification. |
| In the text | |
|
Fig. 4 Left panels: VUV photoabsorption spectra of 1 keV electron irradiated binary ices of (a) CH4, (b) C2H4, and (c) C2H6, mixed with N2 in a 1:1 ratio. Inset panels show regions of interest for molecular product identification. Right panels: VUV photoabsorption spectra of electron irradiated binary ices of (d) CH4, (e) C2H4, and (f) C2H6 mixed with N2 in a 1:1 ratio, during post-irradiative warming. Inset panels show regions of interest for molecular product identification. |
| In the text | |
|
Fig. 5 Left panel: VUV photoabsorption spectra of 1 keV electron irradiated binary ices of (a) C3H8, (b) C6H14, and (c) C8H18 mixed with N2 in a 1:1 ratio. Inset panels show regions of interest for molecular product identification. Right panel: VUV photoabsorption spectra of electron irradiated binary ices of (d) C3H8, (e) C6H14, and (f) C8H18 mixed with N2 in a 1:1 ratio, during post-irradiative warming. Inset panels show regions of interest for molecular product identification. |
| In the text | |
|
Fig. 6 Left panels: VUV photoabsorption spectra of 1 keV electron irradiated binary ices of (a) CH4, (b) C2H4, and (c) C2H6, mixed with NH3 in a 1:1 ratio. Inset panels show regions of interest for molecular product identification. Right panels: VUV photoabsorption spectra of electron irradiated binary ices of (d) CH4, (e) C2H4, and (f) C2H6 mixed with NH3 in a 1:1 ratio, during post-irradiative warming. Inset panels show regions of interest for molecular product identification. |
| In the text | |
|
Fig. 7 Left panels: VUV photoabsorption spectra of 1 keV electron irradiated binary ices of (a) C3H8, (b) C6H14, and (c) C8H18 mixed with NH3 in a 1:1 ratio. Inset panels show regions of interest for molecular product identification. Right panels: VUV photoabsorption spectra of electron irradiated binary ices of (d) C3H8, (e) C6H14, and (f) C8H18 mixed with NH3 in a 1:1 ratio, during post-irradiative warming. Inset panels show regions of interest for molecular product identification. |
| In the text | |
Current usage metrics show cumulative count of Article Views (full-text article views including HTML views, PDF and ePub downloads, according to the available data) and Abstracts Views on Vision4Press platform.
Data correspond to usage on the plateform after 2015. The current usage metrics is available 48-96 hours after online publication and is updated daily on week days.
Initial download of the metrics may take a while.