Fig. 1.
Download original image
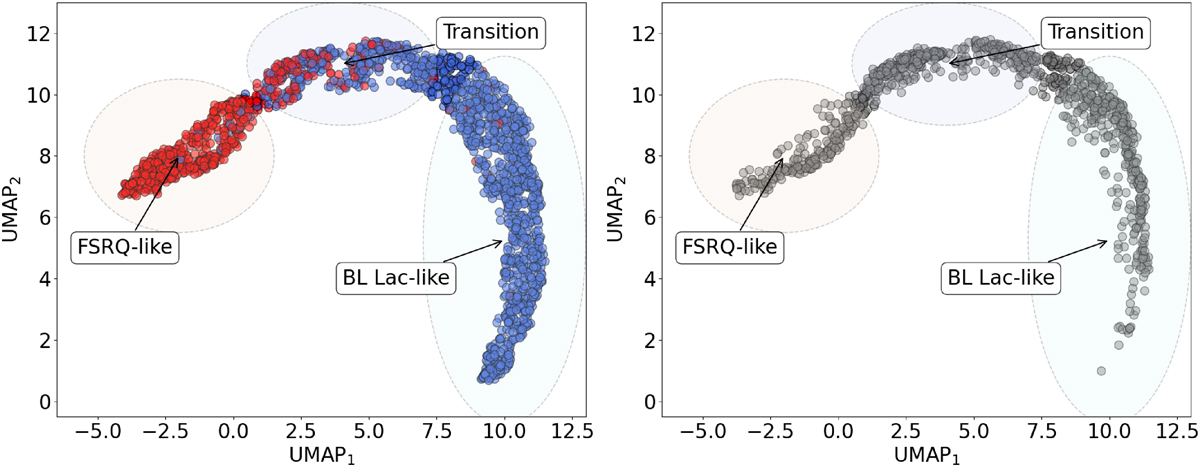
Left: Two-dimensional UMAP representation of the TabPFN latent space for the FSRQs (red) and BL Lacs (blue) of the full FSRQ+BL Lac sample in the 4LAC-DR3 catalogue. Right: Same representation for the BCU sample. To better visualize the regions, ellipses have been overlaid to guide the eye through the latent space structure.
Current usage metrics show cumulative count of Article Views (full-text article views including HTML views, PDF and ePub downloads, according to the available data) and Abstracts Views on Vision4Press platform.
Data correspond to usage on the plateform after 2015. The current usage metrics is available 48-96 hours after online publication and is updated daily on week days.
Initial download of the metrics may take a while.