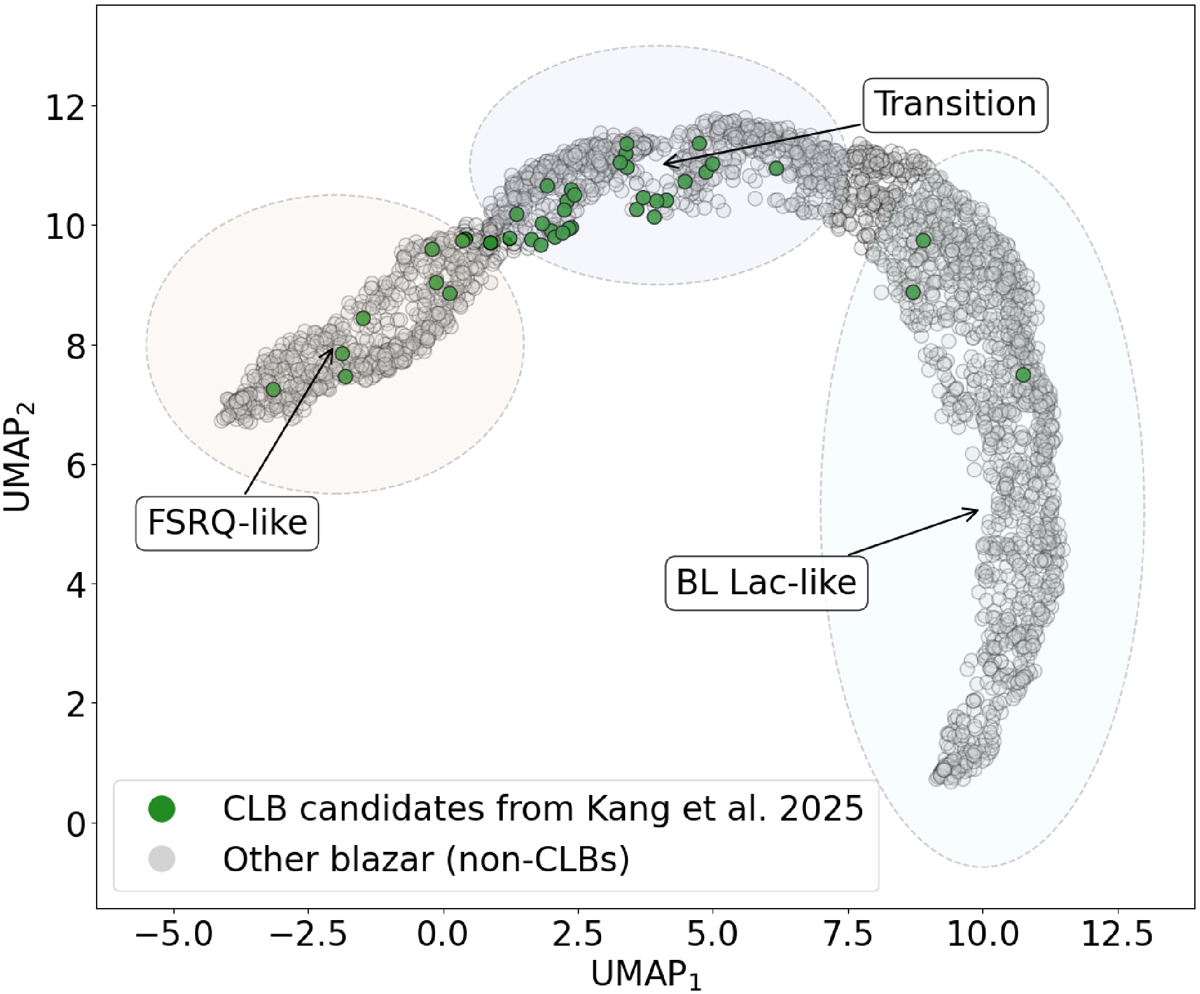
Fig. 10.
Download original image
Two-dimensional UMAP representation of the TabPFN latent space showing a subset of CLBCs from Kang et al. (2025), highlighted in green. All other sources in the sample are shown in grey. The clustering of CLBCs in the intermediate region supports the interpretation of this zone as a transitional phase between FSRQ-like and BL Lac-like states.
Current usage metrics show cumulative count of Article Views (full-text article views including HTML views, PDF and ePub downloads, according to the available data) and Abstracts Views on Vision4Press platform.
Data correspond to usage on the plateform after 2015. The current usage metrics is available 48-96 hours after online publication and is updated daily on week days.
Initial download of the metrics may take a while.