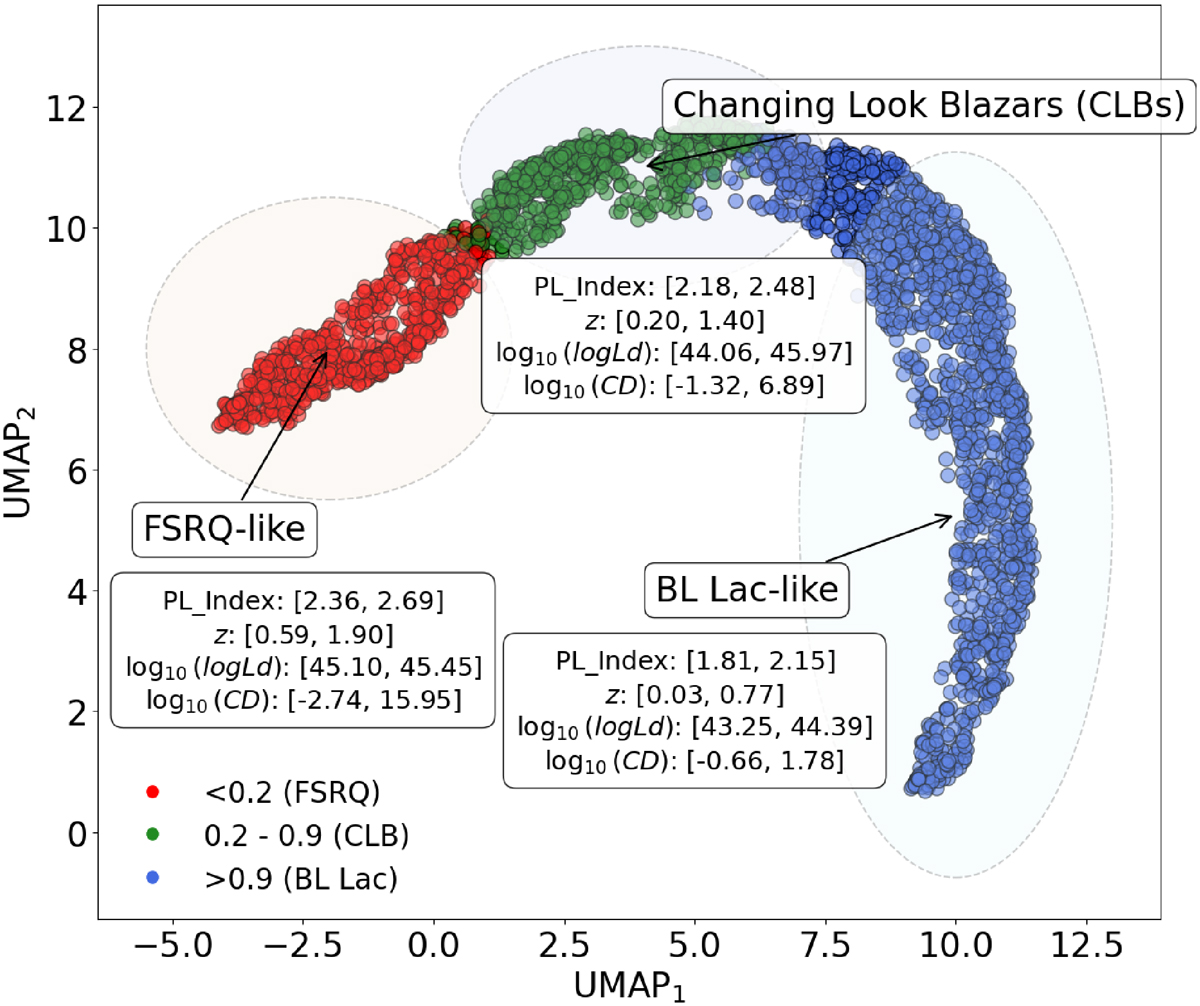
Fig. 9.
Download original image
Unified representation of blazar evolution. The continuous UMAP representation of the TabPFN latent space has been divided into three bins of PBLL, corresponding to the three potential evolutionary phases. For each phase, we provide the characteristic ranges for the most discriminating features. These ranges represent high-density intervals around the KDE peaks identified in the histograms presented in previous sections.
Current usage metrics show cumulative count of Article Views (full-text article views including HTML views, PDF and ePub downloads, according to the available data) and Abstracts Views on Vision4Press platform.
Data correspond to usage on the plateform after 2015. The current usage metrics is available 48-96 hours after online publication and is updated daily on week days.
Initial download of the metrics may take a while.