| Issue |
A&A
Volume 700, August 2025
|
|
|---|---|---|
| Article Number | L20 | |
| Number of page(s) | 8 | |
| Section | Letters to the Editor | |
| DOI | https://doi.org/10.1051/0004-6361/202556370 | |
| Published online | 20 August 2025 | |
Letter to the Editor
Detection of the linear SiC3 and SiC5 radicals in IRC+10216⋆
1
Consejo Superior de Investigaciones Científicas, Instituto de Física Fundamental, C/ Serrano 121, 28006 Madrid, Spain
2
Observatorio Astronómico Nacional (OAN, IGN), Calle Alfonso XII 3, 28014 Madrid, Spain
3
Centro de Desarrollos Tecnológicos, Observatorio de Yebes (IGN), 19141 Yebes, Guadalajara, Spain
4
Institut de Radioastronomie Millimétrique, 300 rue de la Piscine, F-38406 Saint Martin d’Hères, France
⋆⋆ Corresponding authors: This email address is being protected from spambots. You need JavaScript enabled to view it.
; This email address is being protected from spambots. You need JavaScript enabled to view it.
Received:
11
July
2025
Accepted:
29
July
2025
Abstract
We detected the linear 3Σ− radicals SiC3 and SiC5 toward IRC+10216 using an ultrasensitive line survey gathered with the Yebes 40 m radio telescope. The derived column densities of l-SiC3 and l-SiC5 are (3.6 ± 0.4) × 1012 cm−2 and (1.8 ± 0.2) × 1012 cm−2, respectively. The linear SiC3 radical is ∼2 times less abundant that its singlet rhomboidal prolate isomer, for which we provide a new analysis based on recent sensitive observations in the Q band (7 mm), and at 3 and 2 mm with the IRAM 30 m telescope. The emission detected from these species arises from the cool external layers of the circumstellar envelope. We speculate whether ion-neutral routes involving SiCnHm+ cations or neutral-neutral reactions involving Si and SiC2 could efficiently synthesize these species.
Key words: line: identification / molecular data / stars: carbon / circumstellar matter / stars: individual: IRC+10216
Based on observations carried out with the 40 m radio telescope of the Yebes Observatory (projects 19A010, 20A017, 20B014, 21A019, and commissioning observations), operated by the Spanish Geographic Institute (IGN, Ministerio de Transportes, Movilidad y Agenda Urbana). IRAM is supported by INSU/CNRS (France), MPG (Germany) and IGN (Spain).
© The Authors 2025
 Open Access article, published by EDP Sciences, under the terms of the Creative Commons Attribution License (https://creativecommons.org/licenses/by/4.0), which permits unrestricted use, distribution, and reproduction in any medium, provided the original work is properly cited.
This article is published in open access under the Subscribe to Open model. This email address is being protected from spambots. You need JavaScript enabled to view it. to support open access publication.
1. Introduction
The search for chemical complexity in space has received a significant boost in recent years thanks to the ultrasensitive line surveys in the Q band of the starless core TMC-1, the QUIJOTE1 line survey (see, e.g., Cernicharo et al. 2021a,b, 2023a, 2024), and the envelope (IRC+10216) of the carbon-rich star CW Leo (see, e.g., Pardo et al. 2021, 2022, 2025a; Changala et al. 2022; Cernicharo et al. 2023b; Cabezas et al. 2023; Gupta et al. 2024). Since 2020 more than 90 molecules have been found with the Yebes 40 m radio telescope thanks to these ultrasensitive line surveys.
Since the detection of SiC2 in 1984 by Thaddeus et al., this species has been observed toward the envelopes of carbon-rich stars through its rotational transitions in the millimeter and submillimeter domains. These lines provide information on the whole circumstellar envelope of these objects (Lucas et al. 1995; Cernicharo et al. 2010, 2018; Velilla-Prieto et al. 2023). The spatial distribution of SiC2 derived from these high excitation lines is only known in detail toward IRC+10216, where it was observed with the Plateau de Bure interferometer (Guélin et al. 1993; Velilla-Prieto et al. 2019) and the CARMA and ALMA interferometers (Fonfría et al. 2014; Velilla-Prieto et al. 2015, 2023). Observations of three C-rich stars in four low-energy SiC2 transitions at an angular resolution of ∼1″ revealed shell-like structures (Feng et al. 2023). A study with the IRAM 30 m telescope showed that SiC2 is less abundant in denser envelopes, suggesting efficient incorporation of SiC2 into dust grains (Massalkhi et al. 2018).
Apart from SiO, SiS, SiC2, and Si2C (Cernicharo et al. 2015), only a few molecules containing silicon have been found, all of which are present in IRC+10216. Silicon carbide (SiC) was detected in the external shells (300 R* and beyond) of IRC+10216 (Cernicharo et al. 1989; Patel et al. 2013; Velilla-Prieto et al. 2019). It was also detected in the envelopes of several C-rich asymptotic giant branch stars by Massalkhi et al. (2018). Other silicon carbides such as the rhomboidal SiC3 (Apponi et al. 1999a), SiC4 (Ohishi et al. 1989), and SiC6 (Pardo et al. 2025a) have been found in this source with column densities around 10–100 times lower than those of SiC2 and Si2C. SiH4 was detected in the infrared by Keady & Ridgway (1993) and found to be formed at distances larger than 80 stellar radii (Monnier et al. 2000). Additional molecules containing silicon in this source are SiN (Turner 1992), SiH3CH3, and SiH3CN (Cernicharo et al. 2017), and the two isomers SiNC and SiCN (Guélin et al. 2000, 2004), all in low abundances.
The detection of long SiCn chains is expected based on the abundances found for the smaller members. In this Letter we report the detection of the linear 3Σ− radicals SiC3 and SiC5 (hereafter referred to as l-SiC3 and l-SiC5). Linear SiC3 is an isomer of the already detected rhomboidal closed shell species SiC3 (hereafter referred to as r-SiC3; Apponi et al. 1999a). The abundance of the newly detected molecules are compared to those of the other members of the SiCn family and discussed in the context of the possible reactions leading to their formation.
2. Observations
The data presented in this Letter come from a still ongoing 31–50 GHz spectral survey of IRC+10216 (αJ2000 = 09h 47m 57.36s, δJ2000 = +13° 16′ 44.4″) gathered in the framework of the Nanocosmos project2. The data were obtained with the 40 meter antenna of Yebes Observatory (IGN, Spain). A total of 1360 hours of on-source telescope time was acquired between April 2019 and September 2024. The experimental setup is described in detail in Tercero et al. (2021).
The observing mode was position-switching with an off position at 300″ in azimuth. Pointing corrections were obtained by observing the SiO masers of the nearby star R Leo, and errors were always within 5″. The intensity scale of the final calibrated data is antenna temperature (TA*) corrected for atmospheric absorption using the ATM package (Pardo et al. 2001, 2025b). Absolute calibration uncertainties are estimated to be within 10%. Although the primary spectral resolution is 38.1 kHz, the final spectrum was obtained by applying a six-channel box smoothing to the nominal spectrum. Hence, the spectral resolution is Δν = 229 kHz. This line survey is 50–100 times more sensitive than previous surveys of this source at the same frequencies obtained with the Nobeyama 45 m radio telescope (Kawaguchi et al. 1995). The observations with the 30 m IRAM radio telescope have been described in Cernicharo et al. (2019).
3. Results
Line identification was achieved using the MADEX, CDMS, and JPL catalogs (Cernicharo 2012; Müller et al. 2005; Pickett et al. 1998). The datasets were fitted using the SHELL method of the GILDAS3 package. The global fitting procedure described by Pardo et al. (2025a) was adopted to derive the integrated intensities of the lines. Their typical U-shaped profiles, together with the expanding velocity of the envelope (14.5 km s−1; Cernicharo et al. 2000), enabled the detection of very weak lines emerging from IRC+10216.
Rotational line frequencies for l-SiC3 and l-SiC5 are available from laboratory experiments by McCarthy et al. (2000). Both species have a 3Σ− electronic ground state. A dipole moment of 4.8 D was calculated for l-SiC3 in the same work. For l-SiC5 we have assumed a dipole moment of 6.6 D (Müller et al. 2005). Both species have been implemented in MADEX (Cernicharo 2012). The frequency coverage and the large quantum numbers for the laboratory transitions guarantee very good frequency predictions, with uncertainties below a few kilohertz, in the Q band. The observed lines of l-SiC3 are shown in Fig. 1, and those of l-SiC5 are shown in Fig. 2. In spite of the presence of some lines blended with other features, the detection of l-SiC3 is based on the detection of 11 lines, and that of l-SiC5 in 22 lines. For both species, only a few lines are fully blended with strong features. These transitions were not considered for the analysis. Hence, the detection appears robust and permits a detailed analysis of the abundance of these species.
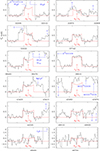 |
Fig. 1. Lines of the linear 3Σ−l-SiC3 radical observed in this work, with their fitted line profile shown in red. Features from other species are labeled in blue. The abscissa corresponds to the rest frequency (in MHz) adopting a vLSR of –26.5 km s−1 (Cernicharo et al. 2000). The ordinate corresponds to the antenna temperature corrected for telescope losses and atmospheric attenuation (in mK). Fully blended lines are indicated by a red star in the upper-right corner of the first panel. Quantum numbers are N (rotational quantum number) and J (total angular momentum, J = N, N ± 1). They are written as NJ. |
We used the observed integrated intensities given in Table A.1 to create rotation diagrams. For l-SiC3 we derive Trot = 5.2 ± 0.5 K and N = (3.6 ± 0.5) × 1012 cm−2. For l-SiC5 the results are Trot = 17.2 ± 1.6 K and N = (1.8 ± 0.3) × 1012 cm−2. These column densities are between those derived by Pardo et al. (2025a) for SiC4 (N = (7.3 ± 1.1) × 1012 cm−2; Trot = 21.5 ± 5 K) and SiC6 (N = (7.9 ± 1.5) × 1011 cm−2; Trot = 19.5 ± 2.1 K).
Laboratory spectroscopy for rhomboidal SiC3 was obtained by McCarthy et al. (1999a) and Apponi et al. (1999b). Its column density in IRC+10216 was derived by Apponi et al. (1999a) from several lines in the millimeter domain to be 4 × 1012 cm−2. No new data on r-SiC3 have been published since then. Hence, we analyze in Appendix B the data we have obtained in the 7 mm (Q band), 3 mm, and 2 mm frequency domains for this species. Two temperature components are found (see Fig. B.1), one with Trot = 15.8 ± 0.9 K and N = (6.5 ± 0.6) × 1012 cm−2. The rotational temperature for this component is similar to that found for l-SiC5, SiC4, and SiC6. A second component is needed with a higher rotational temperature of 44 ± 8 K and a lower column density of (2.1 ± 0.5) × 1012 cm−2. The fact that r-SiC3 has a C2v symmetry with only a-type transitions (only ΔKa = 0 transitions are allowed) introduces significant different excitation conditions from those of l-SiC3 and l-SiC5 (see Appendix B). These results, together with the U-shaped line profiles (see Fig. B.2), indicate that these species are found in the largest abundances in the external layers. For r-SiC3 the warm component with Trot = 44 K could indicate that the molecule starts to be produced in the intermediate layers of the envelope, or that infrared pumping is playing a significant role in the high excitation lines of this molecule. Another isomer, the oblate cyclic SiC3 species, which is 4.7 kcal/mol above the prolate one (Rintelman et al. 2006), has also been observed in the laboratory (McCarthy et al. 1999b). However, only a few lines were measured and, consequently, the frequency predictions are uncertain. Moreover, the dipole moment of this isomer is a factor of 2 below that of the rhomboidal one. Hence, its lines are expected to be at least a factor of 4 weaker than those of r-SiC3 and l-SiC3. Using the 303 − 202 line, which has been measured in the laboratory at 41641.985 ± 0.005 MHz, and adopting the rotational temperature derived for r-SiC3, we derive a 3σ upper limit to the column density of this isomer of 7 × 1011 cm−2.
4. Discussion
It is interesting to compare the column density of rhomboidal SiC3 (see Appendix B) with that of l-SiC3. Despite the fact that the linear 3Σ− isomer is 2.2 kcal/mol above the rhomboidal one (Rintelman et al. 2006), the low rotational temperature components of the two isomers have similar column densities, r-SiC3/l-SiC3 ∼ 1.8. From the observed U-shaped line profiles of the r-SiC3 transitions (see Fig. B.2), it is clear that most of the emission is located in the external layers of the envelope, where the kinetic temperature is ∼25 K (Guélin et al. 2018). The low rotational temperature derived for l-SiC3, Trot ∼ 5.2 K, also suggests a formation in the cold external layers. The difference between the rotational temperatures of the linear (3Σ−) and rhomboidal (1A, C2v symmetry) isomers has to be related to the different structure and excitation conditions of the two species. Moreover, this low Trot is compatible with that derived for species of similar size such as MgC2 (6 ± 1 K; Changala et al. 2022) and CaC2 (5.8 ± 0.6 K; Gupta et al. 2024).
The chemistry of SiC3 in IRC+10216 has been investigated to some extent. MacKay & Charnley (1999) predicted a sizable column density for SiC3 (without distinction of the isomer) of 4.6 × 1012 cm−2. Although not specifically discussed by these authors, in their model SiC3 most likely arises from the photodissociation of SiC4, which was predicted to be five times more abundant than SiC3. Photodissociation of SiC4 is, however, unlikely to be the main source of SiC3 because the observed column density of SiC4 (7.3 × 1012 cm−2; Pardo et al. 2025a) is similar to the sum of those derived for r-SiC3 (4.3 × 1012 cm−2; Apponi et al. 1999a) and l-SiC3 (3.6 × 1012 cm−2; this study).
Other routes leading to SiC3 in current astrochemical databases (Millar et al. 2024; Wakelam et al. 2024) involve the dissociative recombination with electrons of Si-bearing hydrocarbon cations SiCnHm+ formed by ion-neutral reactions involving Si or Si+. The reaction between Si+ and C2H2 has been studied experimentally, and it has been found that the cation SiC2H+ is formed (Wlodek et al. 1991). It would be interesting to investigate how Si+ reacts with polyynes and cyanopolyynes and their radicals, particularly whether radiative association proceeds rapidly for long carbon chains, as observed for metals such as Mg+, Na+, and Al+ (Petrie 1996; Dunbar & Petrie 2002; Cabezas et al. 2023; Cernicharo et al. 2023b). The formation of cationic complexes of the type SiCnH2+, SiCnH+, SiHCnN+, and SiCnN+ followed by their dissociative recombination with electrons could efficiently form the SiCn chains.
Neutral-neutral reactions could also allow SiCn chains to be synthesized. For example, SiC3 could be formed in the reactions Si + C3H and SiC2 + CH, while SiC5 could be produced by the reactions Si + C5H, SiC2 + C3H, and SiC4 + CH. If these reactions are barrierless and proceed through H atom elimination, they can efficiently form SiC3 and SiC5 because they involve reactants that are known or expected to be abundant in the outer circumstellar layers of IRC+10216. However, none of them have been studied either experimentally or theoretically. Reactions of Si with unsaturated closed electronic shell hydrocarbons have been measured to be rapid at low temperatures (Canosa et al. 2001), making it likely that Si reacts efficiently with C3H and C5H. We note that the reaction Si + C2H2 is endothermic for the channel SiCCH + H (Kaiser & Gu 2009), which explains why SiCCH (whose rotational spectrum is known; Apponi et al. 2000; McCarthy et al. 2001) has not been detected in IRC+10216. Other Si-bearing molecules with well-characterized rotational spectra that could result from the various ion-neutral or neutral-neutral routes at work in IRC+10216 are H2CSi, H2CCSi, H2CCCSi, and H2CCCCSi (Izuha et al. 1996; McCarthy & Thaddeus 2002; McCarthy et al. 2024). However, none of them is found in our data at 7, 3, and 2 mm.
In summary, l-SiC3 and l-SiC5 have been found in IRC+10216, completing the family of silicon carbon chains from SiC up to SiC6. The column densities of these species are (3.6 ± 0.4) × 1012 cm−2 and (1.8 ± 0.2) × 1012 cm−2, respectively. They are expected to be formed in the outer envelope. The abundance ratio l-SiC3 over l-SiC5 is ∼2. These species are 17 and 33 times less abundant than SiC (Cernicharo et al. 1989) and have a similar abundance to that of SiC6 (Pardo et al. 2025a). We expect to detect heavier members of the SiCn family with future improved data of IRC+10216.
Q-band Ultrasensitive Inspection Journey to the Obscure TMC-1 Environment.
Acknowledgments
We thank the ERC for funding through grant ERC-2013-SyG-610256-NANOCOSMOS This publication has been also funded by MICIU/AEI/10.13039/501100011033, FEDER and by ESF+ through grants PID2023-147545NB-I00, PID2022-137980NB-100, and RYC2023-045648-I.
References
- Apponi, A. J., McCarthy, M. C., Gottlieb, C., et al. 1999a, ApJ, 516, L103 [Google Scholar]
- Apponi, A. J., Gottlieb, C., McCarthy, M. C., et al. 1999b, J. Chem. Phys., 111, 3911 [Google Scholar]
- Apponi, A. J., McCarthy, M. C., Gottlieb, C. A., et al. 2000, ApJ, 536, L55 [Google Scholar]
- Cabezas, C., Pardo, J. R., Agúndez, M., et al. 2023, A&A, 672, L12 [NASA ADS] [CrossRef] [EDP Sciences] [Google Scholar]
- Canosa, A., Le Picard, S. D., Gougeon, S., et al. 2001, J. Chem. Phys., 115, 6495 [NASA ADS] [CrossRef] [Google Scholar]
- Cernicharo, J. 2012, in ECLA 2011: Europen Conference on Laboratory Astrophysics, (Cambridge: Cambridge Univ. Press), EAS Publications Series, 251, https://nanocosmos.iff.csic.es/?page_id = 1619 [Google Scholar]
- Cernicharo, J., Gottlieb, C., Guélin, M., et al. 1989, ApJ, 341, L25 [NASA ADS] [CrossRef] [Google Scholar]
- Cernicharo, J., Guélin, M., & Kahane, C. 2000, A&AS, 142, 181 [NASA ADS] [CrossRef] [EDP Sciences] [Google Scholar]
- Cernicharo, J., Waters, L. B. F. M., Decin, L., et al. 2010, A&A, 521, L8 [NASA ADS] [CrossRef] [EDP Sciences] [Google Scholar]
- Cernicharo, J., McCarthy, M. C., Gottlieb, C. A., et al. 2015, ApJ, 606, L5 [Google Scholar]
- Cernicharo, J., Agúndez, M., Velilla Prieto, L., et al. 2017, A&A, 606, L5 [NASA ADS] [CrossRef] [EDP Sciences] [Google Scholar]
- Cernicharo, J., Guélin, M., Agúndez, M., et al. 2018, A&A, 618, A4 [NASA ADS] [CrossRef] [EDP Sciences] [Google Scholar]
- Cernicharo, J., Cabezas, C., Pardo, J., et al. 2019, A&A, 630, L2 [NASA ADS] [CrossRef] [EDP Sciences] [Google Scholar]
- Cernicharo, J., Agúndez, M., Kaiser, R. I., et al. 2021a, A&A, 652, L9 [NASA ADS] [CrossRef] [EDP Sciences] [Google Scholar]
- Cernicharo, J., Agúndez, M., Cabezas, C., et al. 2021b, A&A, 649, L15 [EDP Sciences] [Google Scholar]
- Cernicharo, J., Pardo, J. R., Cabezas, C., et al. 2023a, A&A, 670, L19 [NASA ADS] [CrossRef] [EDP Sciences] [Google Scholar]
- Cernicharo, J., Cabezas, C., Pardo, J. R., et al. 2023b, A&A, 672, L13 [NASA ADS] [CrossRef] [EDP Sciences] [Google Scholar]
- Cernicharo, J., Cabezas, C., Fuentetaja, R., et al. 2024, A&A, 690, L13 [NASA ADS] [CrossRef] [EDP Sciences] [Google Scholar]
- Changala, P. B., Gupta, H., Cernicharo, J., et al. 2022, ApJ, 940, L42 [NASA ADS] [CrossRef] [Google Scholar]
- Dunbar, R. C., & Petrie, S. 2002, ApJ, 564, 792 [NASA ADS] [CrossRef] [Google Scholar]
- Feng, Y., Li, X., Millar, T. J., et al. 2023, Front. Astron. Space Sci., 10, 1215642 [NASA ADS] [CrossRef] [Google Scholar]
- Fonfría, J. P., Fernández-López, M., Agúndez, M., et al. 2014, MNRAS, 445, 3289 [NASA ADS] [CrossRef] [Google Scholar]
- Guélin, M., Lucas, R., & Cernicharo, J. 1993, A&A, 280, L19 [NASA ADS] [Google Scholar]
- Guélin, M., Muller, S., Cernicharo, J., et al. 2000, A&A, 363, L9 [NASA ADS] [Google Scholar]
- Guélin, M., Muller, S., Cernicharo, J., et al. 2004, A&A, 426, L49 [NASA ADS] [CrossRef] [EDP Sciences] [Google Scholar]
- Guélin, M., Patel, N. A., Bremer, M., et al. 2018, A&A, 610, A4 [NASA ADS] [CrossRef] [EDP Sciences] [Google Scholar]
- Gupta, H., Changala, P. B., Cernicharo, J., et al. 2024, ApJ, 966, L28 [Google Scholar]
- Izuha, M., Yamamoto, S., & Saito, S. 1996, J. Chem. Phys., 105, 4923 [Google Scholar]
- Kaiser, R. I., & Gu, X. 2009, J. Chem. Phys., 131, 104311 [Google Scholar]
- Kawaguchi, K., Kasai, Y., Ishikawa, S., & Kaifu, N. 1995, PASJ, 47, 853 [Google Scholar]
- Keady, J. J., & Ridgway, S. T. 1993, ApJ, 406, 199 [Google Scholar]
- Lucas, R., Guélin, M., Kahane, C., et al. 1995, Astro. Space Sci., 224, 293 [Google Scholar]
- MacKay, D. D. S., & Charnley, S. B. 1999, MNRAS, 302, 793 [NASA ADS] [CrossRef] [Google Scholar]
- Massalkhi, S., Agúndez, M., Cernicharo, J., et al. 2018, A&A, 611, A29 [CrossRef] [EDP Sciences] [PubMed] [Google Scholar]
- McCarthy, M. C., & Thaddeus, P. 2002, J. Mol. Spectrosc., 211, 228 [Google Scholar]
- McCarthy, M. C., Apponi, A. J., & Thaddeus, P. 1999a, J. Chem. Phys., 110, 10645 [Google Scholar]
- McCarthy, M. C., Apponi, A. J., & Thaddeus, P. 1999b, J. Chem. Phys., 111, 7175 [Google Scholar]
- McCarthy, M. C., Apponi, A. J., Gottlieb, C. A., et al. 2000, ApJ, 538, 766 [Google Scholar]
- McCarthy, M. C., Apponi, A. J., Gottlieb, C. A., & Thaddeus, P. 2001, J. Chem. Phys., 115, 870 [NASA ADS] [CrossRef] [Google Scholar]
- McCarthy, M. C., Changala, P. B., & Carroll, P. B. 2024, J. Mol. Spectrc., 400, A111886 [Google Scholar]
- Millar, T. J., Walsh, C., Van de Sande, M., & Markwick, A. J. 2024, A&A, 682, A109 [NASA ADS] [CrossRef] [EDP Sciences] [Google Scholar]
- Monnier, J. D., Danchi, W. C., Hale, D. S., et al. 2000, ApJ, 543, 868 [NASA ADS] [CrossRef] [Google Scholar]
- Müller, H. S. P., Schlöder, F., Stutzki, J., & Winnewisser, G. 2005, J. Mol. Struct., 742, 215 [Google Scholar]
- Ohishi, M., Kaifu, N., Kawaguchi, K., et al. 1989, ApJ, 345, L83 [CrossRef] [Google Scholar]
- Pardo, J. R., Cernicharo, J., & Serabyn, E. 2001, IEEE Trans. Antennas Propag., 49, 12 [Google Scholar]
- Pardo, J. R., Cabezas, C., Fonfría, P., et al. 2021, A&A, 652, L13 [NASA ADS] [CrossRef] [EDP Sciences] [Google Scholar]
- Pardo, J. R., Cernicharo, J., Tercero, B., et al. 2022, A&A, 658, A39 [NASA ADS] [CrossRef] [EDP Sciences] [Google Scholar]
- Pardo, J. R., Fonfría, J. P., Agúndez, M., et al. 2025a, A&A, 700, L6 [NASA ADS] [CrossRef] [EDP Sciences] [Google Scholar]
- Pardo, J. R., De Breuck, C., Muders, D., et al. 2025b, A&A, 693, A148 [NASA ADS] [CrossRef] [EDP Sciences] [Google Scholar]
- Patel, N. A., Gottlieb, C. A., & Young, K. H. 2013, The Life Cycle of Dust in the Universe: Observations, Theory, and Laboratory Experiments– LCDU 2013, Taipei, Taiwan [Google Scholar]
- Petrie, S. 1996, MNRAS, 282, 807 [NASA ADS] [CrossRef] [Google Scholar]
- Pickett, H. M., Poynter, R. L., Cohen, E. A., et al. 1998, J. Quant. Spectrosc. Radiat. Transfer, 60, 883 [Google Scholar]
- Rintelman, J. M., Gordon, M. S., Fletcher, G. D., & Ivanic, J. 2006, J. Chem. Phys., 124, 034303 [Google Scholar]
- Tercero, F., López-Pérez, J. A., Gallego, J. D., et al. 2021, A&A, 645, A37 [EDP Sciences] [Google Scholar]
- Thaddeus, P., Cummings, S. E., & Linke, R. A. 1984, ApJ, 283, L45 [NASA ADS] [CrossRef] [Google Scholar]
- Turner, B. E. 1992, ApJ, 388, L35 [NASA ADS] [CrossRef] [Google Scholar]
- Velilla-Prieto, L., Cernicharo, J., Quintana-Lacaci, G., et al. 2015, ApJ, 805, L13 [NASA ADS] [CrossRef] [Google Scholar]
- Velilla-Prieto, L., Cernicharo, J., Agúndez, M., et al. 2019, Proc. IAU, 343, 535 [Google Scholar]
- Velilla-Prieto, L., Fonfría, J. P., Agúndez, M., et al. 2023, Nature, 617, 696 [NASA ADS] [CrossRef] [Google Scholar]
- Wakelam, V., Gratier, P., Loison, J.-C., et al. 2024, A&A, 689, A63 [NASA ADS] [CrossRef] [EDP Sciences] [Google Scholar]
- Wlodek, S., Fox, A., & Bohme, D. K. 1991, J. Am. Chem. Soc., 113, 4461 [Google Scholar]
Appendix A: Line parameters
Although the data presented in this work in the Q band correspond to windows of ±8 MHz around the centre frequencies, the data were analysed over a ±100 MHz window to derive accurate sensitivities and baselines. The derived line parameters for the l-SiC3 and l-SiC5 species are given in Table A.1. The lines of l-SiC3 and l-SiC5 are shown in Fig. 1 and 2, respectively. The same method has been used for all the lines of the rhomboidal isomer of SiC3 observed with the Yebes 40m radio telescope at 7 mm, and the IRAM 30m telescope at 3 and 2 mm. The derived line parameters for this species are given in Table B.1 and the observed lines are shown in Fig. B.2.
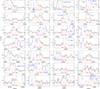 |
Fig. 2. Lines of l-SiC5 observed in this work. Features from other species are labeled in blue. Fully blended lines are indicated by a red star in the upper-right corner of the corresponding panel. Fitted line profiles, abscissa, ordinate, and quantum numbers are as in Fig. 1. |
Derived line parameters for the lines of l-SiC3 and l-SiC5 in the Q band.
Appendix B: Rhomboidal SiC3
The rhomboidal isomer of SiC3 was discovered in IRC+10216 by Apponi et al. (1999a) from the observation of seven lines in the 3 mm domain. Transitions of this species at 2mm were also observed by Cernicharo et al. (2000). Here, we report the detection of 45 rotational transitions of this isomer with upper energy levels of up to 114 K. Line parameters were derived in a similar way to those of l-SiC3 and l-SiC5 and are given in Table B.1. The rotational analysis of these data is shown in Fig. B.1 (see below).
Most observed lines have an excellent S/N and exhibit U-shaped line profiles (see Fig. B.2). This implies that the emerging lines are formed in the external layers of the envelope. From the observed intensities we can estimate from a rotation diagram (see Fig. B.1) the rotational temperature and column density of the molecule. A global fit to all the data provides Trot = 24.1±1.2 K and N=(6.2±1.2)×1012 cm−2. The fit is shown as a dashed red line in Fig. B.1. However, from the observed intensities it appears that for the lines with upper level energies below 50 K (Ka = 0, 2, and 4) the rotational temperature is considerably lower, Trot = 15.8±0.9 K. The column density for this gas component is N=(6.5±0.6)×1012 cm−2. The fit is shown in Fig. B.1 as a blue line. The rotational temperature for this gas component is similar to that of l-SiC5, SiC4 and SiC6. Finally, a warmer gas component is found for transitions with energies of their upper levels above 50 K (Ka≥4). The derived rotational temperature for this component is 44±8 K and its column density is (2.1±0.5)×1012 cm−2 (purple line in Fig. B.1). These results are in reasonable agreement with those derived by Apponi et al. (1999a) from a more reduced number of lines and with lower sensitivities.
The lack of collisional rates for the SiC3 isomers avoids a detailed study of their excitation conditions. However, as indicated previously by Apponi et al. (1999a), the symmetry of r-SiC3 and the fact that only ΔKa = 0 radiative transitions are allowed, introduce some peculiarities in the population mechanisms of its energy levels. Collisions could connect all levels independently of the value of Ka, while radiation could connect only levels within a K-ladder. Hence, we expect to have low rotational temperatures within the K-ladders, and higher rotational temperatures across K-ladders. This is following what is represented in Fig. B.1 and the intensities provided in Table B.1. The colors for the data points in this figure corresponds to the different values of Ka. For each color, i.e., for each Ka, the slope of the data is practically the same. The data for different values of Ka are shifted in energy (compare for example Ka = 4 and Ka = 6), but keep the same slope (rotational temperature). The data for Ka = 0 and 2 can be fitted simultaneously and provide a rotational temperature of 15.7±0.6 K. For the Ka = 4 and Ka = 6 ladders the derived rotational temperature is of 17.8±1.4 K and 18.6±1.6 K, respectively. Hence, the average intra-ladder rotational temperature is ∼17 K, while the cross-ladder is ∼44 K. The intra-ladder temperature is very similar to that obtained for the rotational temperatures of the linear chains l-SiC3, SiC4, l-SiC5, and SiC6.
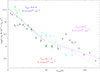 |
Fig. B.1. Rotational diagram for the lines of r-SiC3. The blue line correspond to a fit to all transitions with energy of their upper level lower than 50 K. The purple one corresponds to the fit to all data with upper level energies above 50 K. The dashed red line corresponds to a global fit to all the data and represents an averaged temperature and column density. The data for each Ka is represented by the same color (black for Ka = 0, green for Ka = 2, cyan for Ka = 4 and blue for Ka = 6. |
Derived line parameters for the lines of rhomboidal SiC3 at 7, 3, and 2 mm.
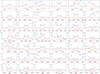 |
Fig. B.2. Lines of r-SiC3 observed in this work at 7, 3, and 2mm. The red lines show the fitted line profiles (see text). Features from other species are labeled in blue. Abscissa and ordinate as in Fig. 1. |
All Tables
All Figures
|
Fig. 1. Lines of the linear 3Σ−l-SiC3 radical observed in this work, with their fitted line profile shown in red. Features from other species are labeled in blue. The abscissa corresponds to the rest frequency (in MHz) adopting a vLSR of –26.5 km s−1 (Cernicharo et al. 2000). The ordinate corresponds to the antenna temperature corrected for telescope losses and atmospheric attenuation (in mK). Fully blended lines are indicated by a red star in the upper-right corner of the first panel. Quantum numbers are N (rotational quantum number) and J (total angular momentum, J = N, N ± 1). They are written as NJ. |
| In the text | |
|
Fig. 2. Lines of l-SiC5 observed in this work. Features from other species are labeled in blue. Fully blended lines are indicated by a red star in the upper-right corner of the corresponding panel. Fitted line profiles, abscissa, ordinate, and quantum numbers are as in Fig. 1. |
| In the text | |
|
Fig. B.1. Rotational diagram for the lines of r-SiC3. The blue line correspond to a fit to all transitions with energy of their upper level lower than 50 K. The purple one corresponds to the fit to all data with upper level energies above 50 K. The dashed red line corresponds to a global fit to all the data and represents an averaged temperature and column density. The data for each Ka is represented by the same color (black for Ka = 0, green for Ka = 2, cyan for Ka = 4 and blue for Ka = 6. |
| In the text | |
|
Fig. B.2. Lines of r-SiC3 observed in this work at 7, 3, and 2mm. The red lines show the fitted line profiles (see text). Features from other species are labeled in blue. Abscissa and ordinate as in Fig. 1. |
| In the text | |
Current usage metrics show cumulative count of Article Views (full-text article views including HTML views, PDF and ePub downloads, according to the available data) and Abstracts Views on Vision4Press platform.
Data correspond to usage on the plateform after 2015. The current usage metrics is available 48-96 hours after online publication and is updated daily on week days.
Initial download of the metrics may take a while.