Open Access
Fig. 10
Download original image
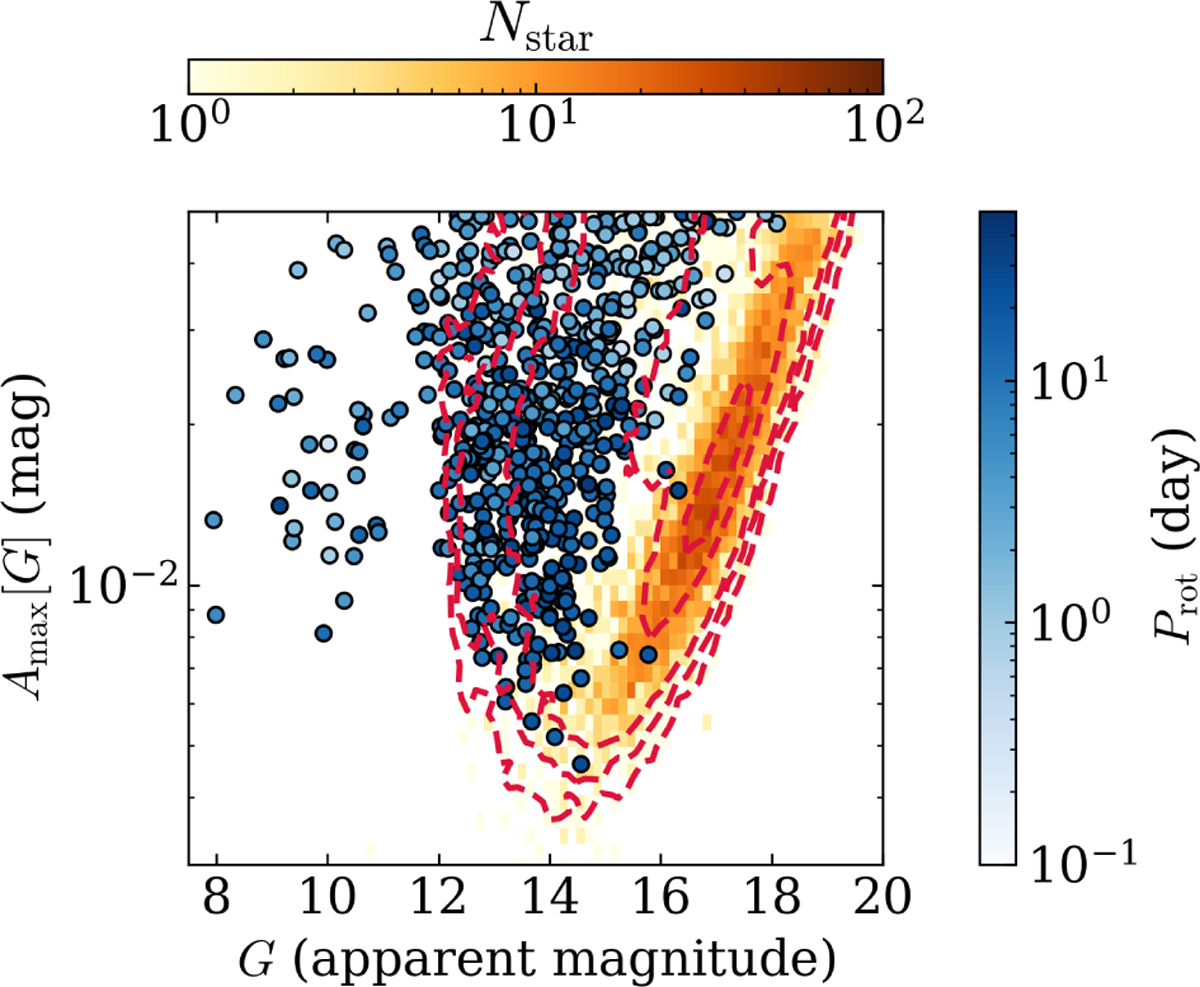
Amax [G] vs G diagram for K2 stars (dots) with Prot colour-coded, compared with the density map of Gaia DR3 low-activity UFR stars located at absolute ecliptic latitude lower than 10°. The density contours (dashed red) of the full Gaia DR3 rotation catalogue are represented for comparison.
Current usage metrics show cumulative count of Article Views (full-text article views including HTML views, PDF and ePub downloads, according to the available data) and Abstracts Views on Vision4Press platform.
Data correspond to usage on the plateform after 2015. The current usage metrics is available 48-96 hours after online publication and is updated daily on week days.
Initial download of the metrics may take a while.