Fig. 13
Download original image
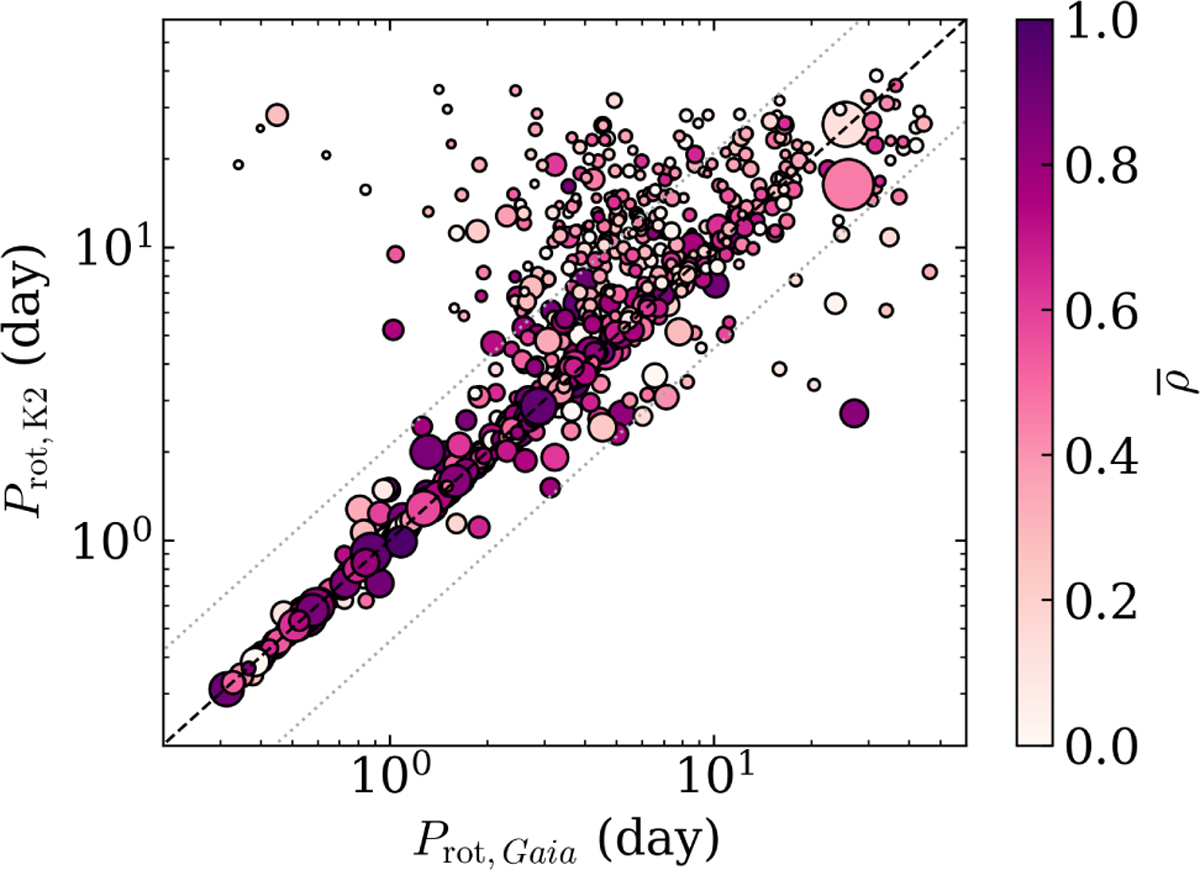
Comparison between the rotation periods measured and validated in the K2 light curves, Prot,K2, and the reference values from the Gaia DR2 and DR3 catalogues, Prot,Gaia. The 1:0.45, 1:2.1 (dotted grey lines), and 1:1 (dashed black line) lines are shown. The mean correlation coefficient ρ̄ is colour-coded, and the dot size is proportional to the Amax[G] index. For readability, the ρ̄ values are colour-coded only in the 0 to 1 range.
Current usage metrics show cumulative count of Article Views (full-text article views including HTML views, PDF and ePub downloads, according to the available data) and Abstracts Views on Vision4Press platform.
Data correspond to usage on the plateform after 2015. The current usage metrics is available 48-96 hours after online publication and is updated daily on week days.
Initial download of the metrics may take a while.