Fig. 14
Download original image
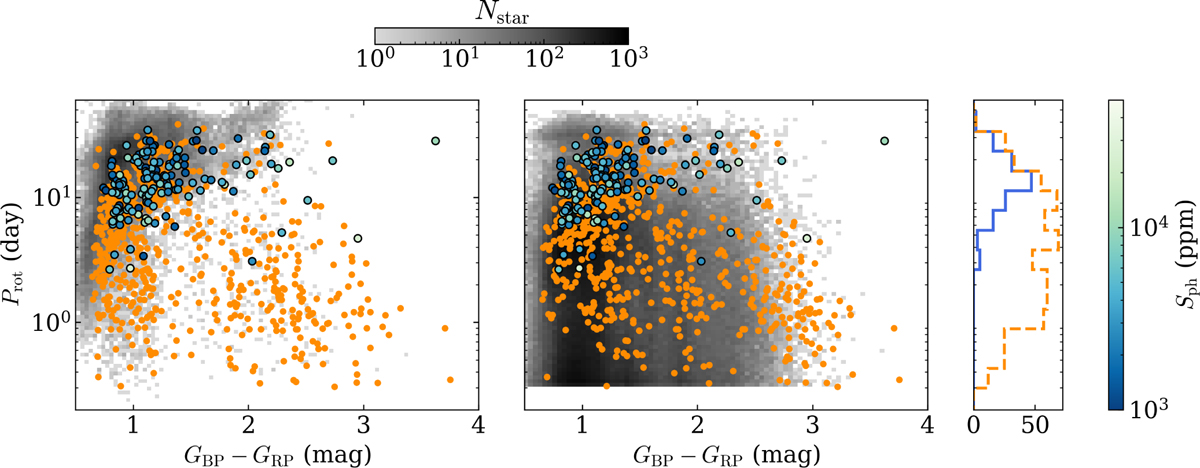
Prot vs GBP - GRP diagram. The Sph value is colour-coded for the stars for which Gaia and K2 rotation measurements are cross-validated. The stars for which the measurements are consistent are shown in orange. In the left panel the sample is compared with the density distribution of the Kepler stars from Santos et al. (2019, 2021) (in grey), while in the right panel it is compared with the density distribution of the stars from Gaia DR3 (in grey).
Current usage metrics show cumulative count of Article Views (full-text article views including HTML views, PDF and ePub downloads, according to the available data) and Abstracts Views on Vision4Press platform.
Data correspond to usage on the plateform after 2015. The current usage metrics is available 48-96 hours after online publication and is updated daily on week days.
Initial download of the metrics may take a while.