Open Access
Fig. 2
Download original image
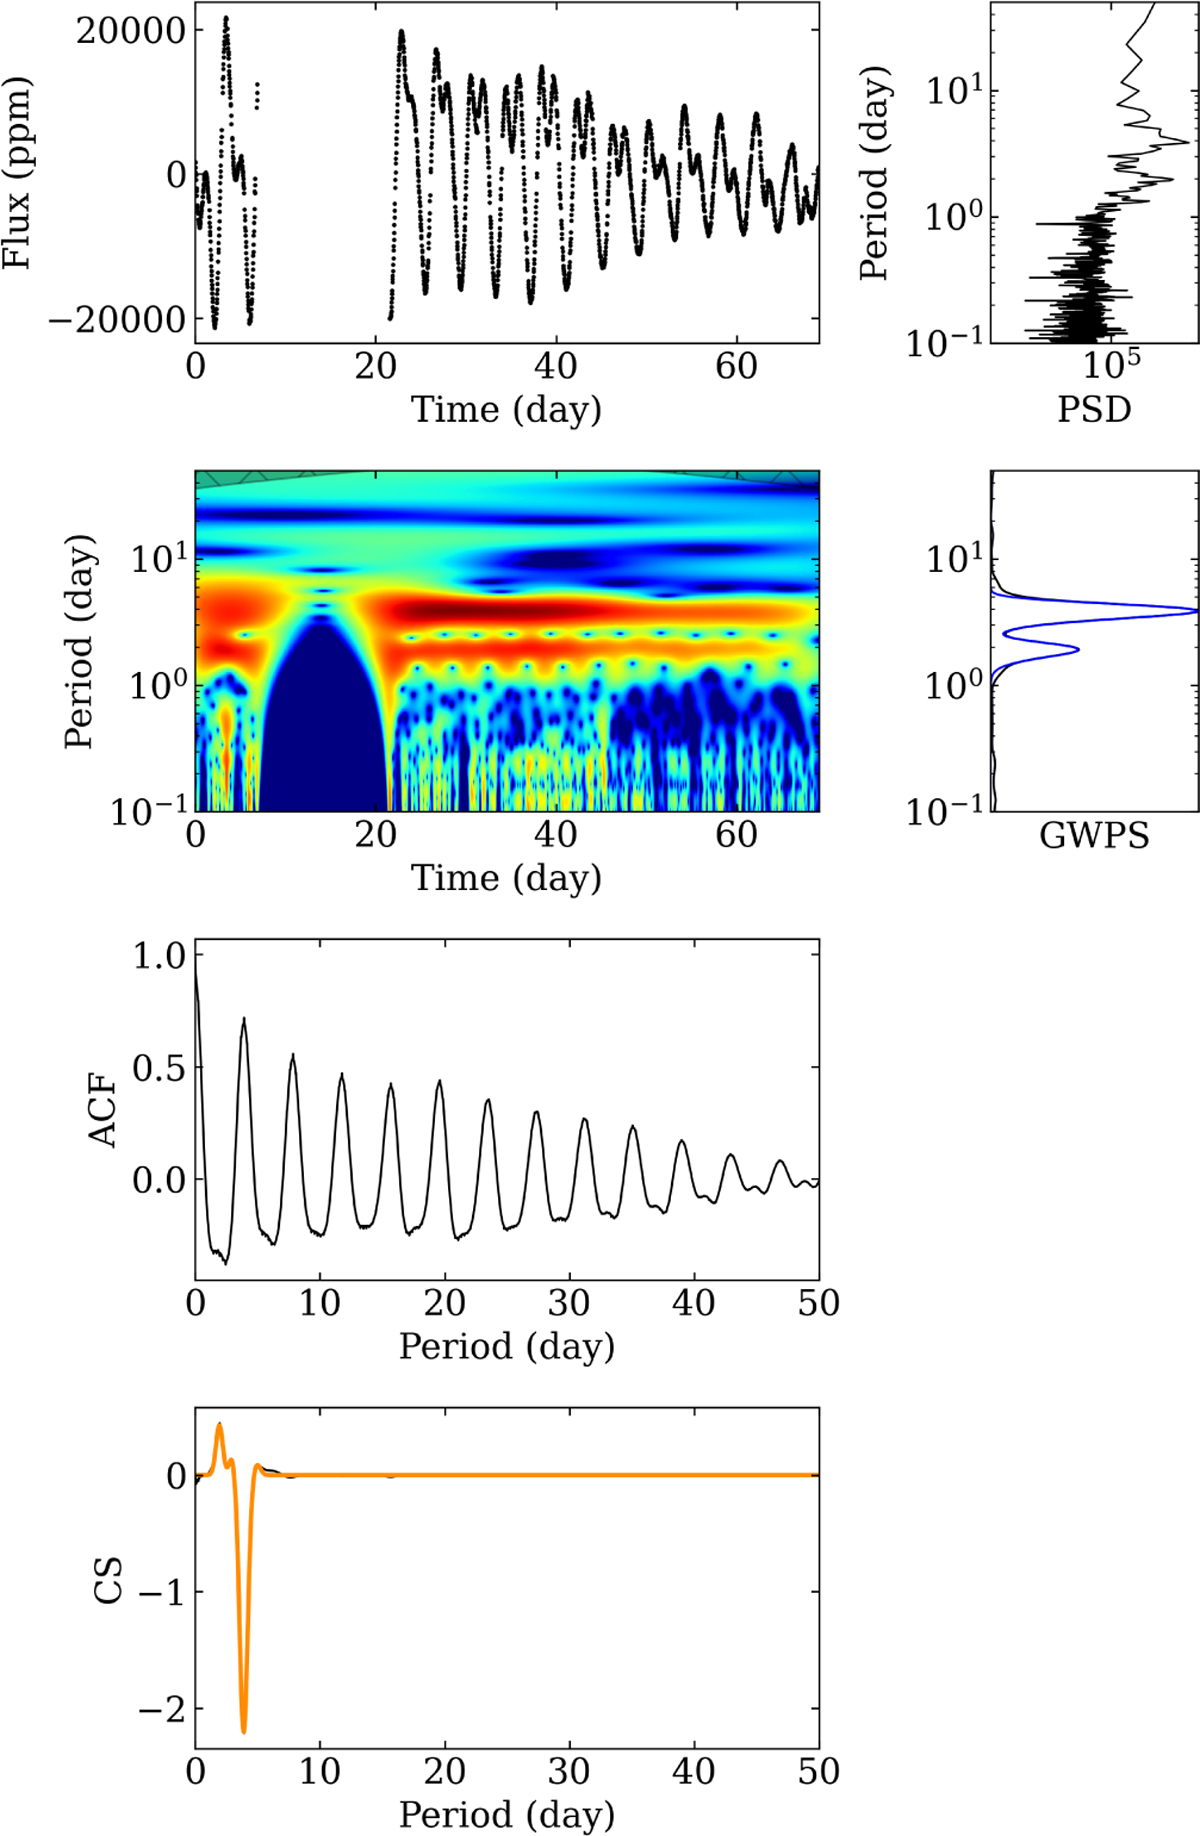
From top to bottom: light curve (left) and power spectral density (right), WPS (left) and GWPS (right), ACF, and CS for EPIC 201121691. The set of Gaussian profiles fitted on the GWPS and the CS are shown in blue and orange, respectively.
Current usage metrics show cumulative count of Article Views (full-text article views including HTML views, PDF and ePub downloads, according to the available data) and Abstracts Views on Vision4Press platform.
Data correspond to usage on the plateform after 2015. The current usage metrics is available 48-96 hours after online publication and is updated daily on week days.
Initial download of the metrics may take a while.