Fig. 9
Download original image
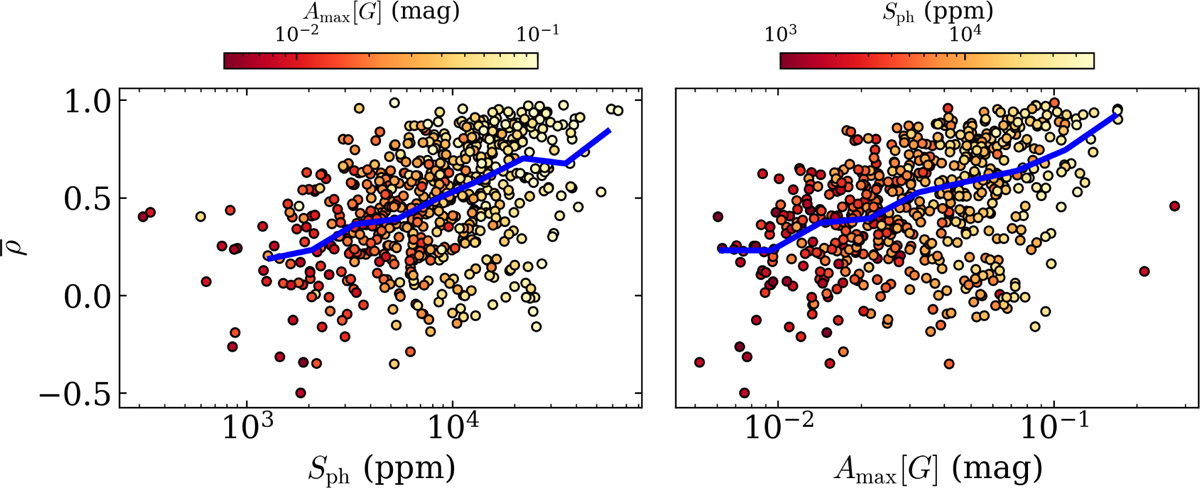
Left: ρ̄ vs S ph diagram for the stars where the rotation period measured between K2 and Gaia is cross-validated. Amax[G] is colour-coded. The median value of the binned distribution along Amax[G] is shown in blue. Right: ρ̄ vs Amax[G] diagram for the stars where the rotation period measured between K2 and Gaia is cross-validated. Sph is colour-coded. The median value of the binned distribution along Sph is shown in blue.
Current usage metrics show cumulative count of Article Views (full-text article views including HTML views, PDF and ePub downloads, according to the available data) and Abstracts Views on Vision4Press platform.
Data correspond to usage on the plateform after 2015. The current usage metrics is available 48-96 hours after online publication and is updated daily on week days.
Initial download of the metrics may take a while.