Fig. 1
Download original image
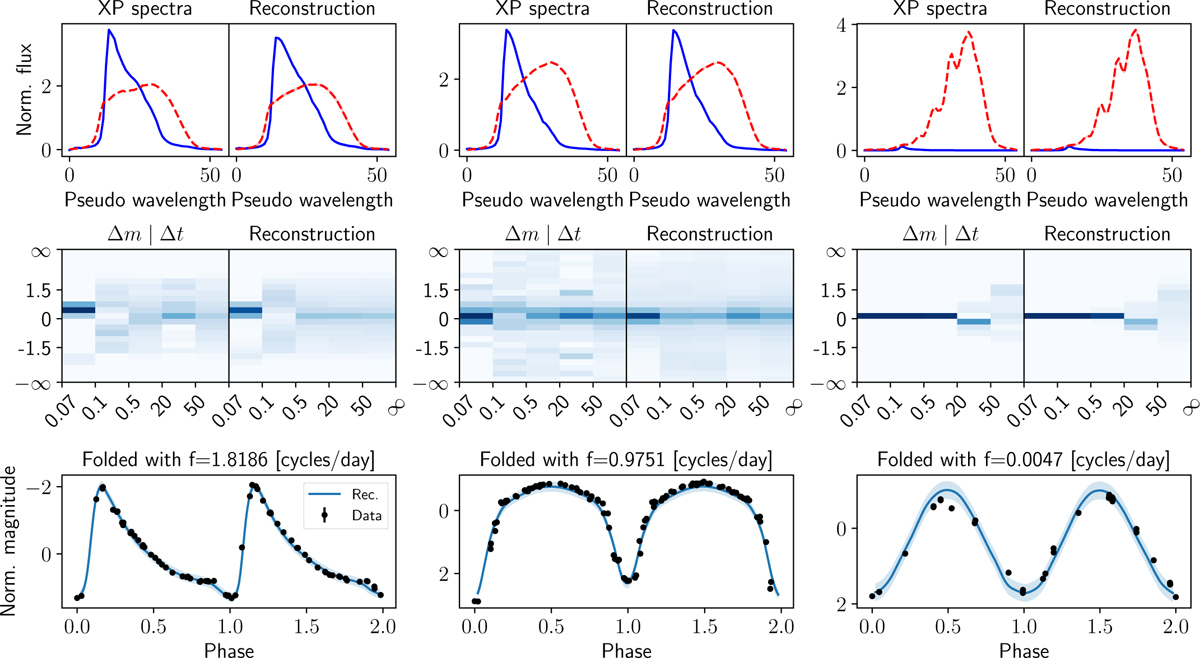
Input data and VAE reconstructions for three variable Gaia DR3 sources. The sources shown in each column are associated with the RR Lyr ab star, ECLb, and LPV classes, respectively. Each row corresponds to a specific data modality and shows the preprocessed input data (prior to compression) and its reconstruction (after decompression) using the VAEs described in Sections 4.1, 4.2, and 4.3. The first row corresponds to the sampled representation of the Gaia BP (solid blue) and RP (dashed red) low-resolution spectra. The second row depicts the conditional distribution of magnitude differences given time differences of the Gaia G band light curves. The third row shows the Gaia G band light curve folded with its dominant period.
Current usage metrics show cumulative count of Article Views (full-text article views including HTML views, PDF and ePub downloads, according to the available data) and Abstracts Views on Vision4Press platform.
Data correspond to usage on the plateform after 2015. The current usage metrics is available 48-96 hours after online publication and is updated daily on week days.
Initial download of the metrics may take a while.