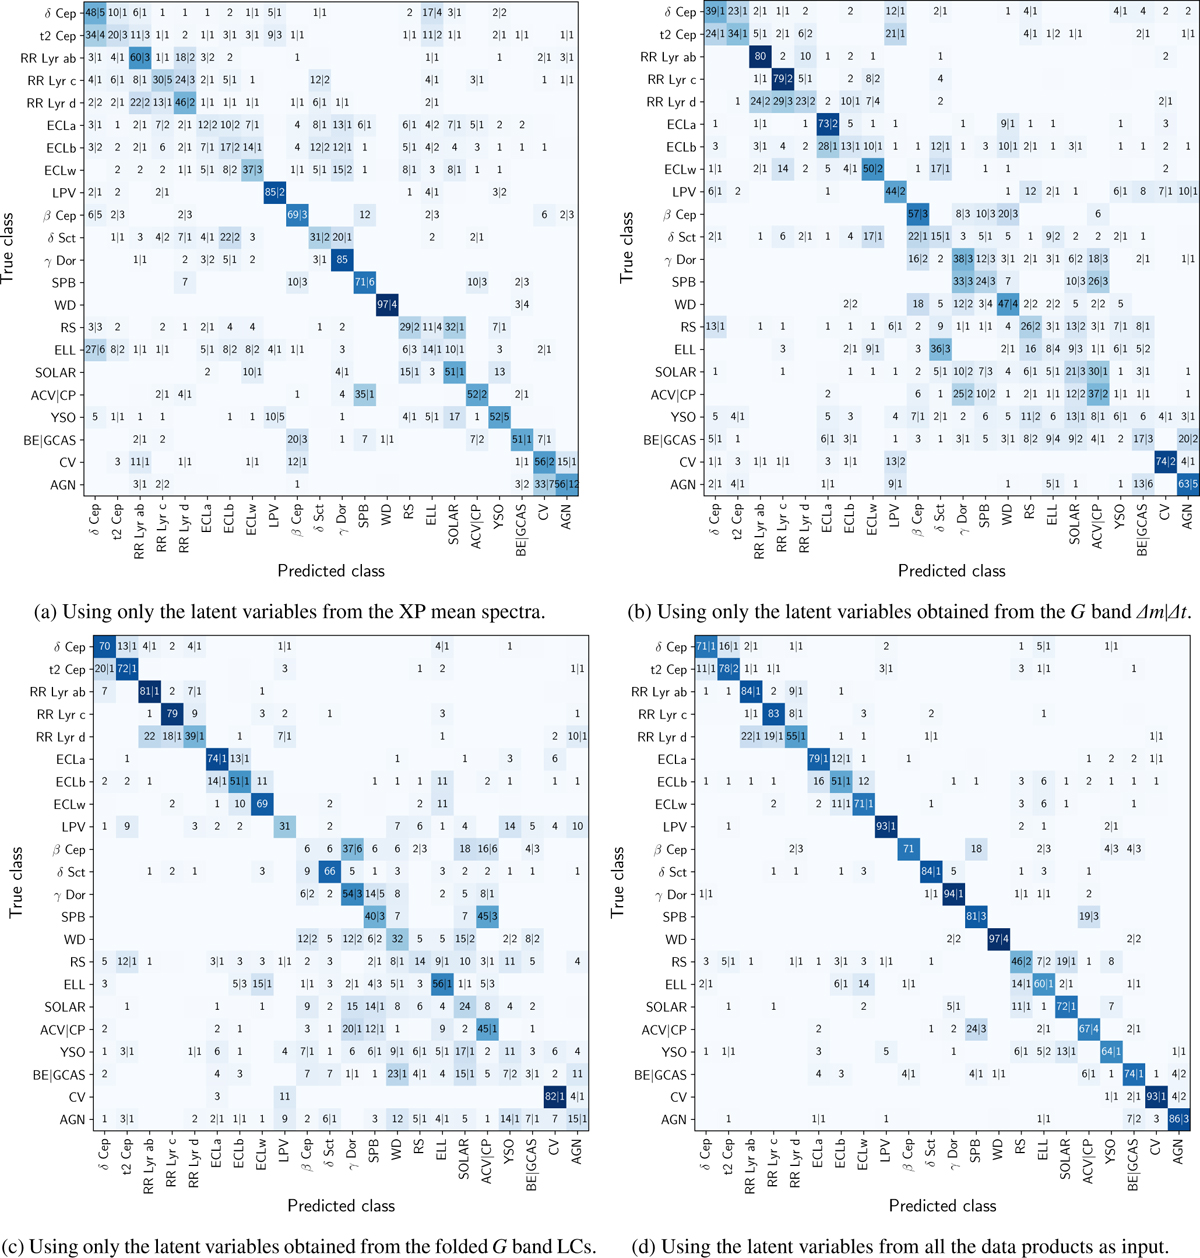
Fig. 11
Download original image
Confusion matrices for the test partition sources of the labelled subset. The rows correspond to the ground truth class selected from Gavras et al. (2023), and the columns to the class predicted by the classifier using the latent variables as input. The cell in the i-th row and j-th column gives the percentage of sources labelled as class i and predicted as class j with respect to the total number of sources of class i. Each matrix represents the averaged results of a linear classifier trained on different sets of latent variables. Standard deviations are shown after the | symbol. Percentage rates and corresponding standard deviations below 1% are not shown for clarity.
Current usage metrics show cumulative count of Article Views (full-text article views including HTML views, PDF and ePub downloads, according to the available data) and Abstracts Views on Vision4Press platform.
Data correspond to usage on the plateform after 2015. The current usage metrics is available 48-96 hours after online publication and is updated daily on week days.
Initial download of the metrics may take a while.