Fig. 13
Download original image
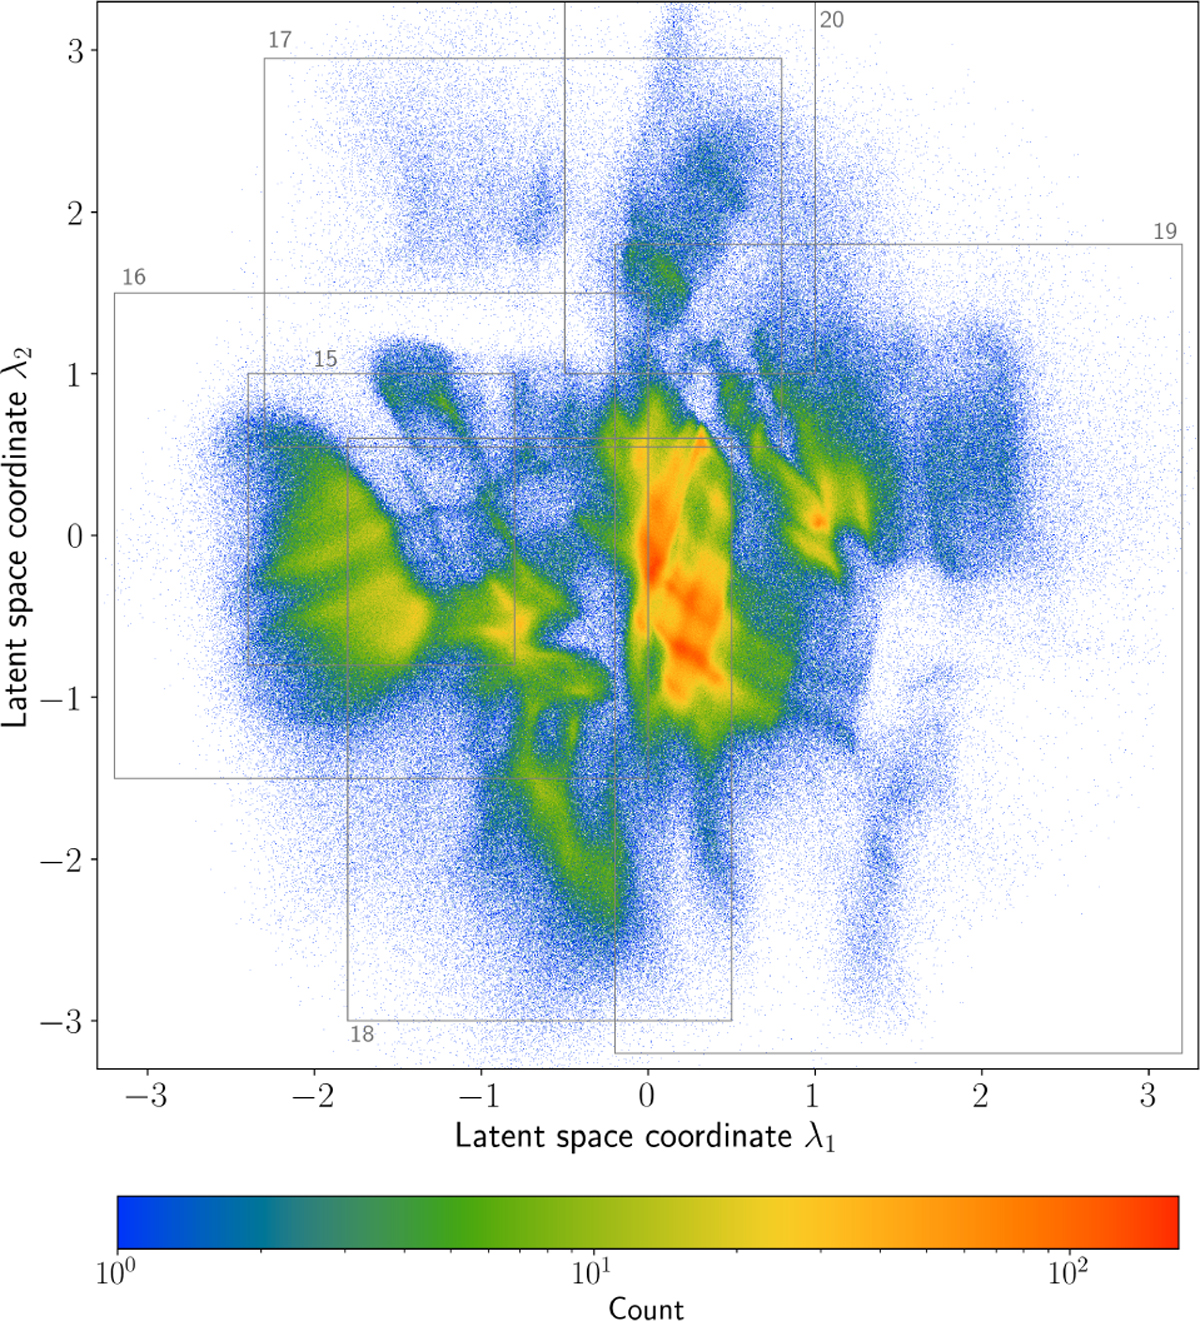
Distribution of the 4 136 544 sources in the 2 D latent output space of our ANN designed to perform an unsupervised clustering of variable sources (see Section 4 and Fig. 5 for more details). Different overdensities of points correspond to different (sub)types of variability. A first identification of the overdensities can be found in Fig. 14. For future reference we also depict the parts of this latent space shown in Figs. 15–20 with rectangles and provide the figure number is in one of the corners.
Current usage metrics show cumulative count of Article Views (full-text article views including HTML views, PDF and ePub downloads, according to the available data) and Abstracts Views on Vision4Press platform.
Data correspond to usage on the plateform after 2015. The current usage metrics is available 48-96 hours after online publication and is updated daily on week days.
Initial download of the metrics may take a while.