Open Access
Fig. 15
Download original image
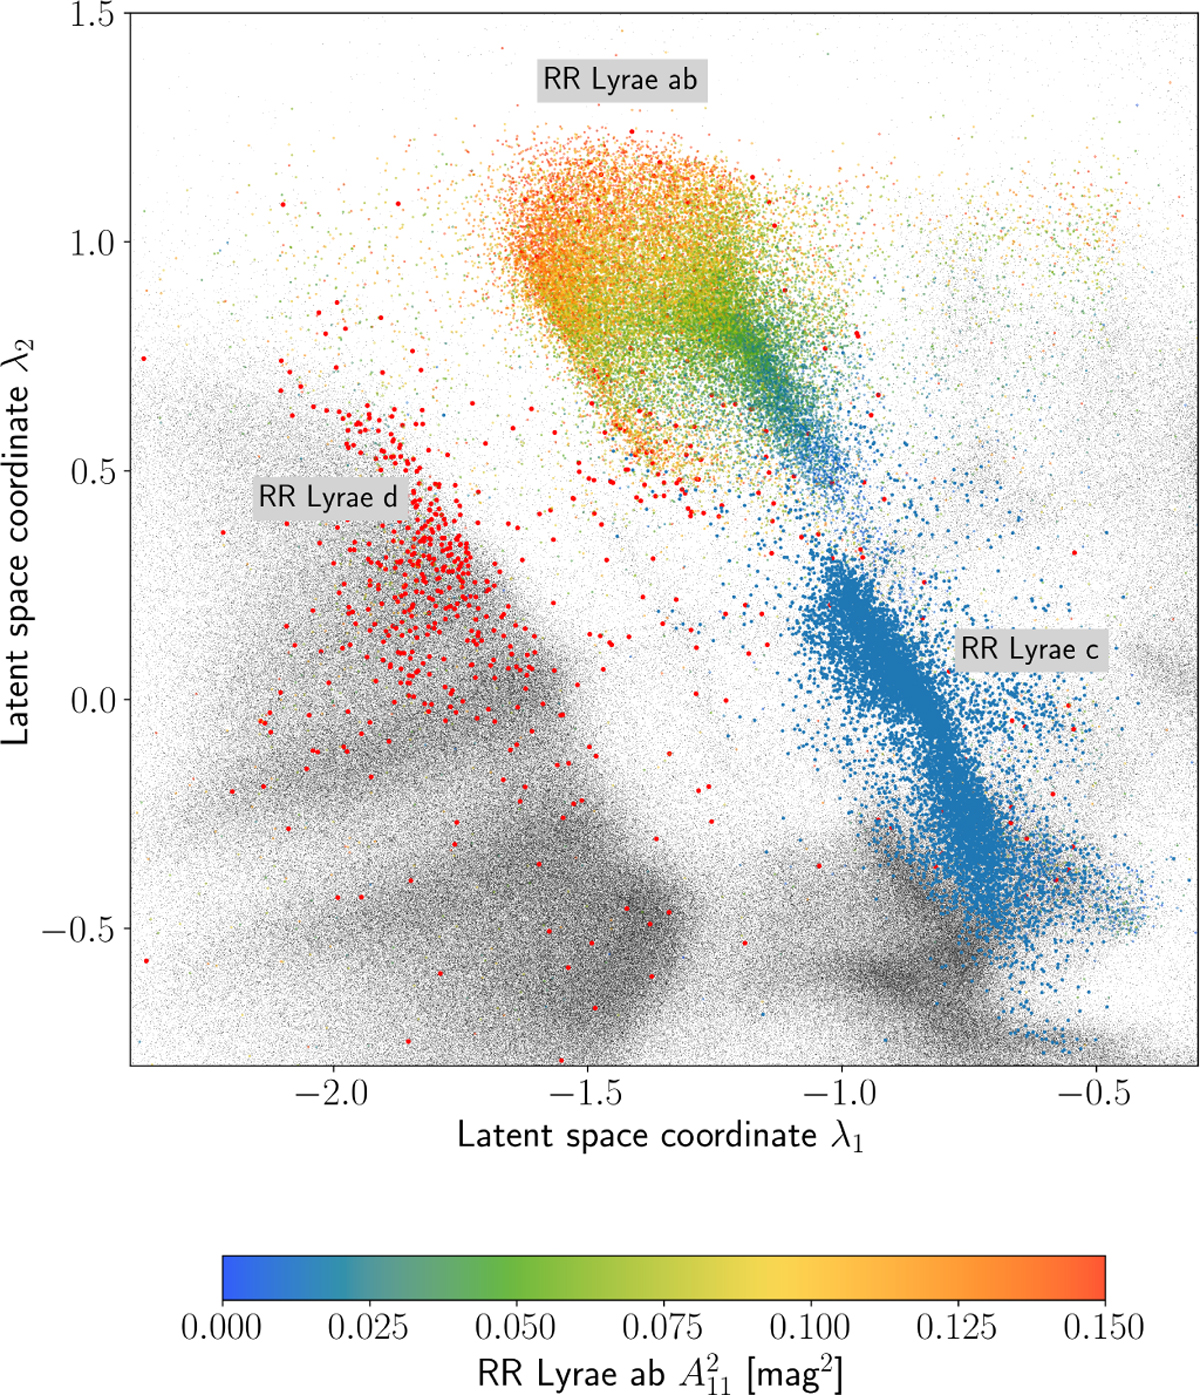
Region of the latent space where the RR Lyr stars are located. The RR Lyr variables for which a “RRab” classification label was available in the Gaia DR3 catalogue are overplotted in colour, where we used the pulsation amplitude A11 for the colour scale. The RR Lyr c and RR Lyr d variables are plotted in blue resp. red.
Current usage metrics show cumulative count of Article Views (full-text article views including HTML views, PDF and ePub downloads, according to the available data) and Abstracts Views on Vision4Press platform.
Data correspond to usage on the plateform after 2015. The current usage metrics is available 48-96 hours after online publication and is updated daily on week days.
Initial download of the metrics may take a while.