Fig. 18
Download original image
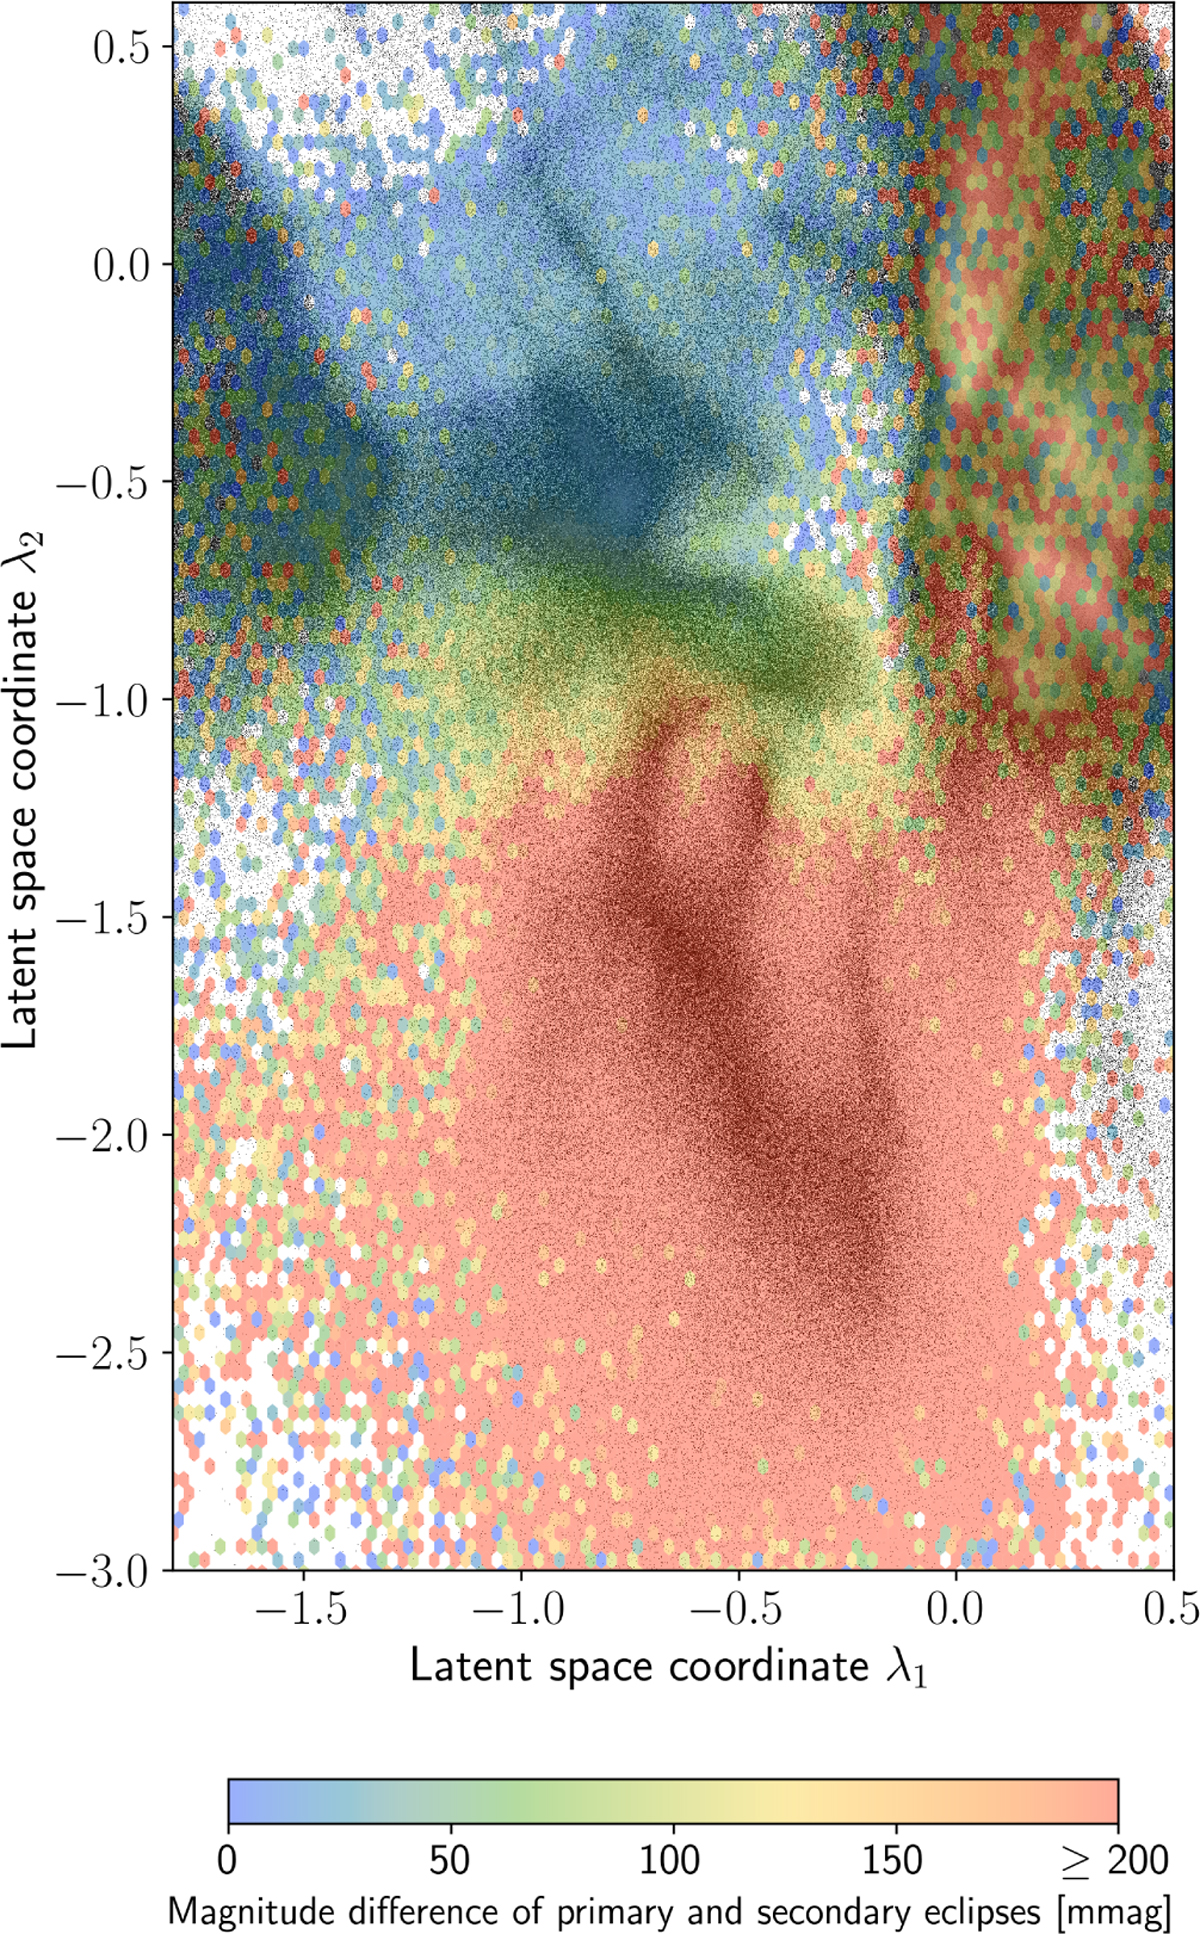
Part of the latent space where the ANN projects eclipsing and ellipsoidal binaries. The grey background shows the same density as in Fig. 13. Sources that were published in the Gaia DR3 Variability catalogue gaiadr3.vari_eclipsing_binary are overplotted in a 2D histogram of small hexagons where the colour of each hexagon corresponds to the average magnitude difference between primary and secondary eclipses of the sources inside that bin.
Current usage metrics show cumulative count of Article Views (full-text article views including HTML views, PDF and ePub downloads, according to the available data) and Abstracts Views on Vision4Press platform.
Data correspond to usage on the plateform after 2015. The current usage metrics is available 48-96 hours after online publication and is updated daily on week days.
Initial download of the metrics may take a while.