Fig. A.5
Download original image
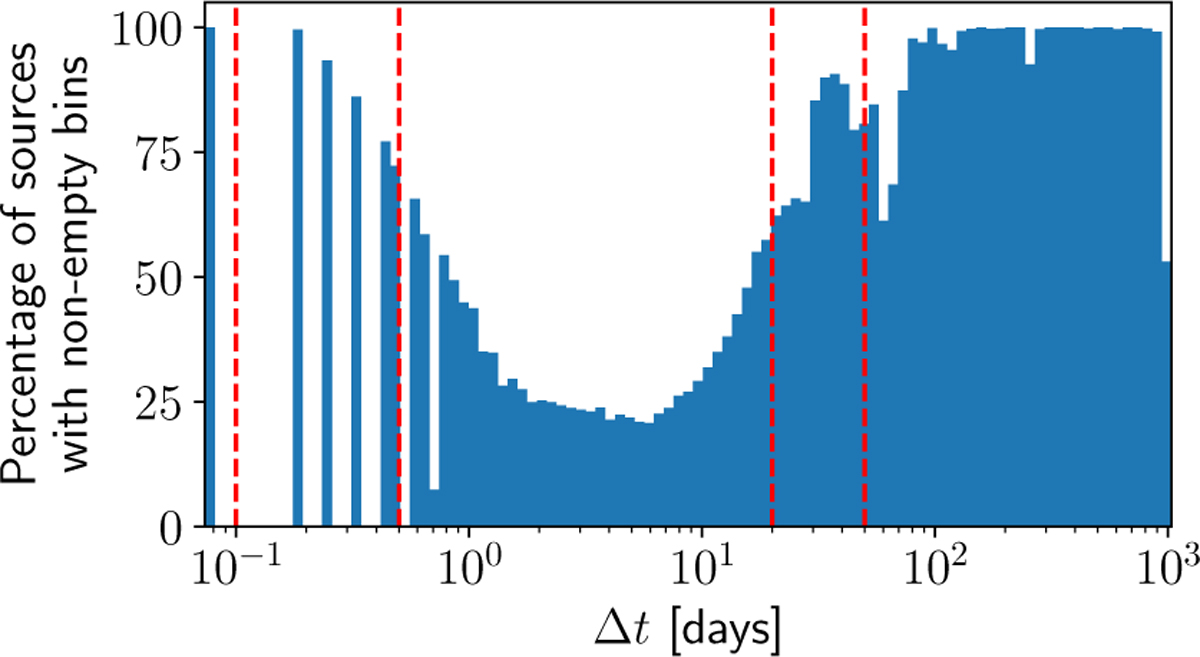
Percentage of sources with at least one pair of observations whose time difference falls in a given Δt bin. For each source the time differences are extracted and then binned in 100 equally spaced logarithmic bins. The structure is a result of Gaia’s sampling. The red dashed lines mark the edges of the low-resolution Δt bins used in this work. All sources have at least one observation in each of these low-resolution bins.
Current usage metrics show cumulative count of Article Views (full-text article views including HTML views, PDF and ePub downloads, according to the available data) and Abstracts Views on Vision4Press platform.
Data correspond to usage on the plateform after 2015. The current usage metrics is available 48-96 hours after online publication and is updated daily on week days.
Initial download of the metrics may take a while.