Fig. 5
Download original image
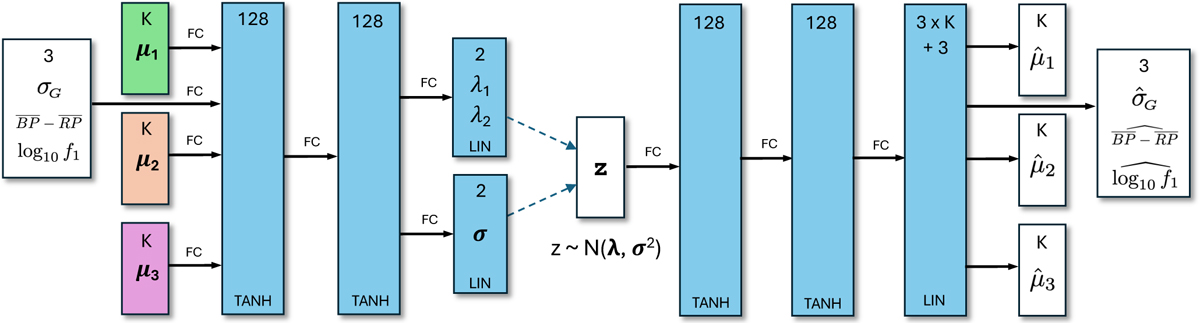
Variational autoencoder used to further reduce the latent spaces produced by the networks illustrated in Figs. 2–4 (the green, orange, and purple rectangles) to a latent space of dimension 2, providing the coordinates (λ1, λ2) that are used for the interpretation in Section 9. Apart from the location in the 3K = 15-dimensional latent space, the VAE also receives the standard deviation of the G light curve, the colour estimate ![]() , and the (logarithm of) the main frequency, f1, in the Lomb-Scargle periodogram. The explanation of the ANN is similar to the one in Fig. 2.
, and the (logarithm of) the main frequency, f1, in the Lomb-Scargle periodogram. The explanation of the ANN is similar to the one in Fig. 2.
Current usage metrics show cumulative count of Article Views (full-text article views including HTML views, PDF and ePub downloads, according to the available data) and Abstracts Views on Vision4Press platform.
Data correspond to usage on the plateform after 2015. The current usage metrics is available 48-96 hours after online publication and is updated daily on week days.
Initial download of the metrics may take a while.