Fig. 6
Download original image
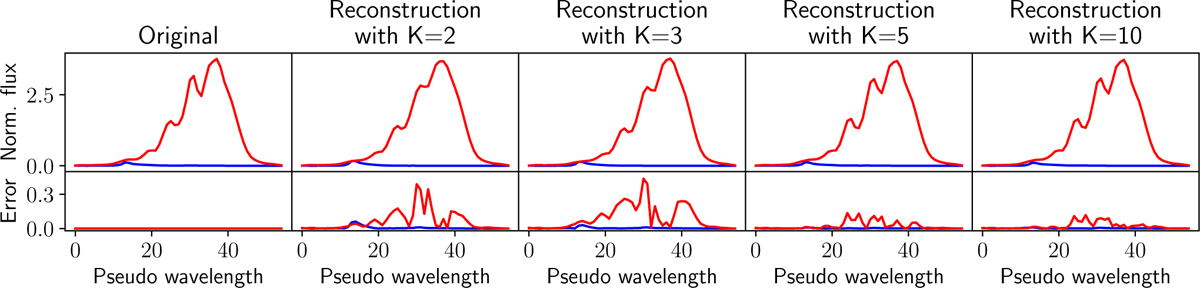
Gaia DR3 source 4037765863920151040 XP mean spectra corresponding to a long period variable (first column). These data were compressed using the VAE and then reconstructed. The following columns show the reconstruction and the squared difference between the original and its reconstruction as the number of latent variables, K, increases.
Current usage metrics show cumulative count of Article Views (full-text article views including HTML views, PDF and ePub downloads, according to the available data) and Abstracts Views on Vision4Press platform.
Data correspond to usage on the plateform after 2015. The current usage metrics is available 48-96 hours after online publication and is updated daily on week days.
Initial download of the metrics may take a while.