Fig. 9
Download original image
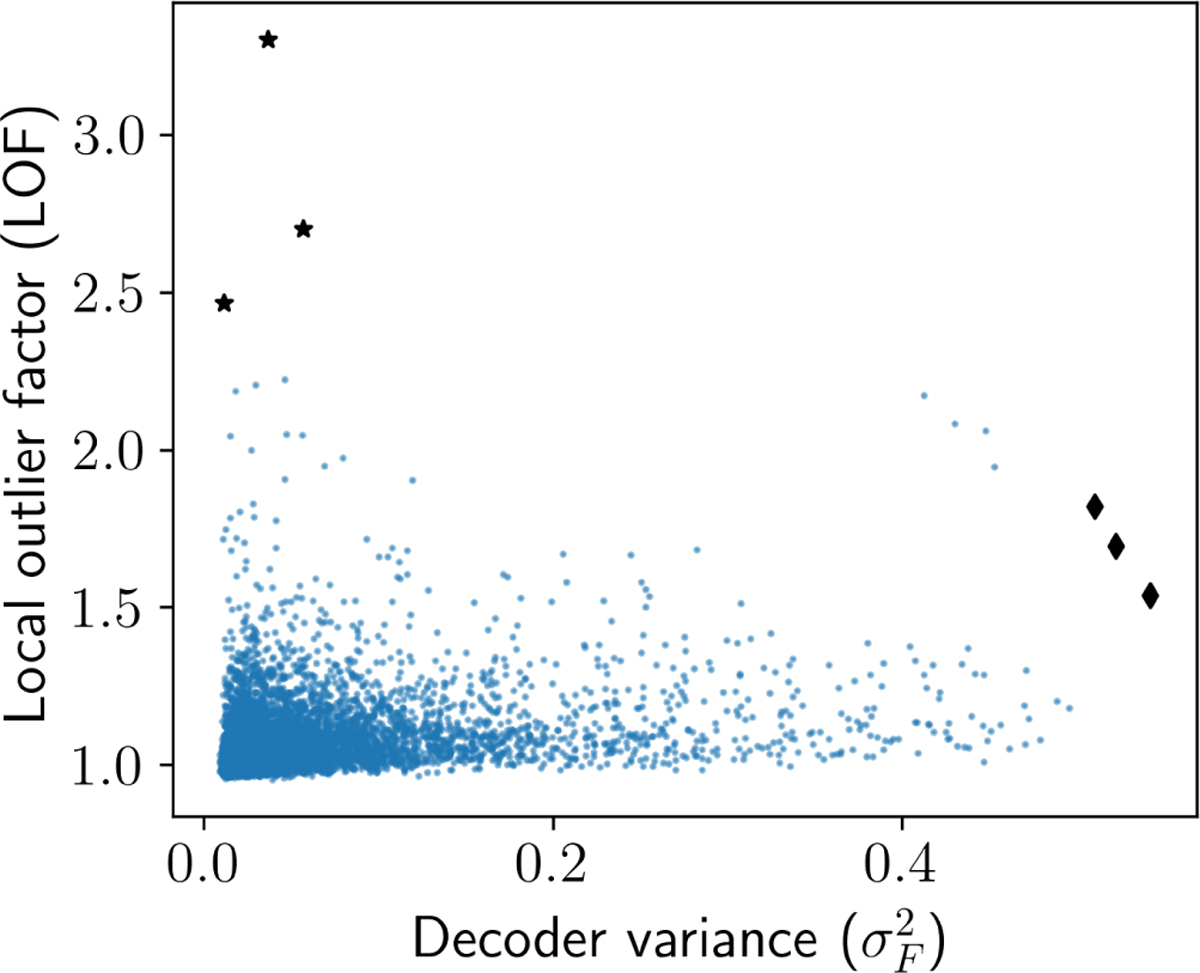
Local outlier factor vs the variance of the G band folded light curve decoder (![]() ) for the 7431 sources from the RR Lyr SOS table within the test partition. A large LOF indicates that the source is isolated in the latent space. A large
) for the 7431 sources from the RR Lyr SOS table within the test partition. A large LOF indicates that the source is isolated in the latent space. A large ![]() is associated with a noisy reconstruction of the folded light curve. Black stars show the three sources with the largest LOF, while black diamonds show the three sources with the largest
is associated with a noisy reconstruction of the folded light curve. Black stars show the three sources with the largest LOF, while black diamonds show the three sources with the largest ![]() .
.
Current usage metrics show cumulative count of Article Views (full-text article views including HTML views, PDF and ePub downloads, according to the available data) and Abstracts Views on Vision4Press platform.
Data correspond to usage on the plateform after 2015. The current usage metrics is available 48-96 hours after online publication and is updated daily on week days.
Initial download of the metrics may take a while.