Fig. 1.
Download original image
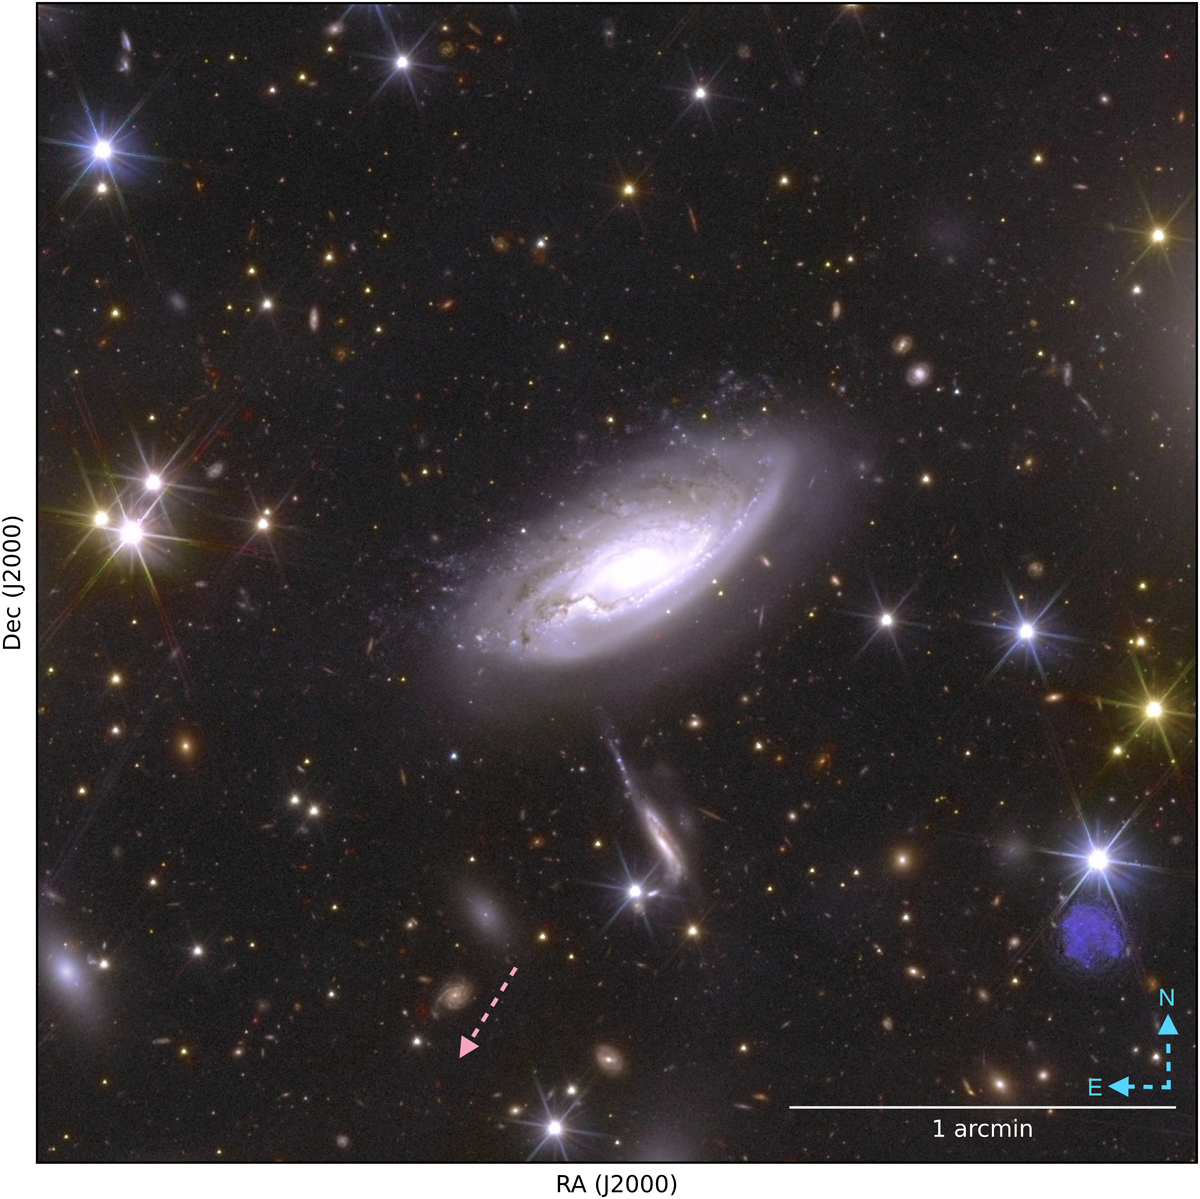
Colour-composite image of the UGC 2665 galaxy created by combining and assigning blue, green, and red colours for IE, YE, and HE imaging data. The direction to the cluster centre is shown with a light magenta-coloured arrow. In the bottom right of the image, the blue patch is an artefact caused by dichroic ghost in IE imaging.
Current usage metrics show cumulative count of Article Views (full-text article views including HTML views, PDF and ePub downloads, according to the available data) and Abstracts Views on Vision4Press platform.
Data correspond to usage on the plateform after 2015. The current usage metrics is available 48-96 hours after online publication and is updated daily on week days.
Initial download of the metrics may take a while.