| Issue |
A&A
Volume 701, September 2025
|
|
|---|---|---|
| Article Number | A40 | |
| Number of page(s) | 26 | |
| Section | Extragalactic astronomy | |
| DOI | https://doi.org/10.1051/0004-6361/202554836 | |
| Published online | 02 September 2025 | |
Euclid: Early Release Observations of ram-pressure stripping in the Perseus cluster
Detection of parsec-scale star formation within the low surface brightness stripped tails of UGC 2665 and MCG +07-07-070⋆
1
University Observatory, LMU Faculty of Physics, Scheinerstrasse 1 81679 Munich, Germany
2
Aix-Marseille Université, CNRS, CNES, LAM, Marseille, France
3
Université Paris-Saclay, Université Paris Cité, CEA, CNRS, AIM, 91191 Gif-sur-Yvette, France
4
Universitäts-Sternwarte München, Fakultät für Physik, Ludwig-Maximilians-Universität München, Scheinerstrasse 1 81679 München, Germany
5
Université de Strasbourg, CNRS, Observatoire astronomique de Strasbourg, UMR 7550, 67000 Strasbourg, France
6
School of Physics and Astronomy, University of Nottingham, University Park, Nottingham NG7 2RD, UK
7
INAF-Osservatorio di Astrofisica e Scienza dello Spazio di Bologna, Via Piero Gobetti 93/3 40129 Bologna, Italy
8
Indian Institute of Astrophysics, Koramangala II Block, Bangalore 560034, India
9
Department of Physics and Electronics, CHRIST (Deemed to be University), Bangalore 560029, India
10
Waterloo Centre for Astrophysics, University of Waterloo, Waterloo, Ontario N2L 3G1, Canada
11
Leiden Observatory, Leiden University, Einsteinweg 55 2333 CC Leiden, The Netherlands
12
Institute of Astronomy, University of Cambridge, Madingley Road, Cambridge CB3 0HA, UK
13
Sterrenkundig Observatorium, Universiteit Gent, Krijgslaan 281 S9 9000 Gent, Belgium
14
Kapteyn Astronomical Institute, University of Groningen, PO Box 800 9700 AV, Groningen, The Netherlands
15
Ludwig-Maximilians-University, Schellingstrasse 4 80799 Munich, Germany
16
Univ. Lille, CNRS, Centrale Lille, UMR 9189 CRIStAL, 59000 Lille, France
17
Université Paris-Saclay, CNRS, Institut d’astrophysique spatiale, 91405 Orsay, France
18
Space physics and astronomy research unit, University of Oulu, Pentti Kaiteran katu 1 FI-90014, Oulu, Finland
19
ESAC/ESA, Camino Bajo del Castillo, s/n., Urb. Villafranca del Castillo 28692 Villanueva de la Cañada, Madrid, Spain
20
School of Mathematics and Physics, University of Surrey, Guildford, Surrey GU2 7XH, UK
21
INAF-Osservatorio Astronomico di Brera, Via Brera 28 20122 Milano, Italy
22
IFPU, Institute for Fundamental Physics of the Universe, Via Beirut 2 34151 Trieste, Italy
23
INAF-Osservatorio Astronomico di Trieste, Via G. B. Tiepolo 11 34143 Trieste, Italy
24
INFN, Sezione di Trieste, Via Valerio 2 34127 Trieste TS, Italy
25
SISSA, International School for Advanced Studies, Via Bonomea 265 34136 Trieste, TS, Italy
26
Dipartimento di Fisica e Astronomia, Università di Bologna, Via Gobetti 93/2 40129 Bologna, Italy
27
INFN-Sezione di Bologna, Viale Berti Pichat 6/2 40127 Bologna, Italy
28
INAF-Osservatorio Astronomico di Padova, Via dell’Osservatorio 5 35122, Padova, Italy
29
INAF-Osservatorio Astrofisico di Torino, Via Osservatorio 20 10025 Pino Torinese (TO), Italy
30
Dipartimento di Fisica, Università di Genova, Via Dodecaneso 33 16146 Genova, Italy
31
INFN-Sezione di Genova, Via Dodecaneso 33 16146 Genova, Italy
32
Department of Physics “E. Pancini”, University Federico II, Via Cinthia 6 80126 Napoli, Italy
33
INAF-Osservatorio Astronomico di Capodimonte, Via Moiariello 16 80131 Napoli, Italy
34
Instituto de Astrofísica e Ciências do Espaço, Universidade do Porto, CAUP, Rua das Estrelas PT4150-762, Porto, Portugal
35
Faculdade de Ciências da Universidade do Porto, Rua do Campo de Alegre 4150-007, Porto, Portugal
36
Dipartimento di Fisica, Università degli Studi di Torino, Via P. Giuria 1 10125 Torino, Italy
37
INFN-Sezione di Torino, Via P. Giuria 1 10125 Torino, Italy
38
European Space Agency/ESTEC, Keplerlaan 1 2201 AZ Noordwijk, The Netherlands
39
Institute Lorentz, Leiden University, Niels Bohrweg 2 2333 CA Leiden, The Netherlands
40
INAF-IASF Milano, Via Alfonso Corti 12 20133 Milano, Italy
41
Centro de Investigaciones Energéticas, Medioambientales y Tecnológicas (CIEMAT), Avenida Complutense 40 28040 Madrid, Spain
42
Port d’Informació Científica, Campus UAB, C. Albareda s/n 08193 Bellaterra (Barcelona), Spain
43
Institute for Theoretical Particle Physics and Cosmology (TTK), RWTH Aachen University, 52056 Aachen, Germany
44
INAF-Osservatorio Astronomico di Roma, Via Frascati 33 00078 Monteporzio Catone, Italy
45
INFN section of Naples, Via Cinthia 6 80126 Napoli, Italy
46
Institute for Astronomy, University of Hawaii, 2680 Woodlawn Drive, Honolulu, HI 96822, USA
47
Dipartimento di Fisica e Astronomia “Augusto Righi” – Alma Mater Studiorum Università di Bologna, Viale Berti Pichat 6/2 40127 Bologna, Italy
48
Instituto de Astrofísica de Canarias, Vía Láctea 38205 La Laguna, Tenerife, Spain
49
Institute for Astronomy, University of Edinburgh, Royal Observatory, Blackford Hill, Edinburgh EH9 3HJ, UK
50
Jodrell Bank Centre for Astrophysics, Department of Physics and Astronomy, University of Manchester, Oxford Road, Manchester M13 9PL, UK
51
European Space Agency/ESRIN, Largo Galileo Galilei 1 00044 Frascati, Roma, Italy
52
Université Claude Bernard Lyon 1, CNRS/IN2P3, IP2I Lyon, UMR 5822, Villeurbanne F-69100, France
53
Institut de Ciències del Cosmos (ICCUB), Universitat de Barcelona (IEEC-UB), Martí i Franquès 1 08028 Barcelona, Spain
54
Institució Catalana de Recerca i Estudis Avançats (ICREA), Passeig de Lluís Companys 23 08010 Barcelona, Spain
55
UCB Lyon 1, CNRS/IN2P3, IUF, IP2I Lyon, 4 rue Enrico Fermi 69622 Villeurbanne, France
56
Mullard Space Science Laboratory, University College London, Holmbury St Mary, Dorking, Surrey RH5 6NT, UK
57
Departamento de Física, Faculdade de Ciências, Universidade de Lisboa, Edifício C8, Campo Grande PT1749-016, Lisboa, Portugal
58
Instituto de Astrofísica e Ciências do Espaço, Faculdade de Ciências, Universidade de Lisboa, Campo Grande 1749-016, Lisboa, Portugal
59
Department of Astronomy, University of Geneva, ch. d’Ecogia 16 1290 Versoix, Switzerland
60
INAF-Istituto di Astrofisica e Planetologia Spaziali, Via del Fosso del Cavaliere, 100 00100 Roma, Italy
61
INFN-Padova, Via Marzolo 8 35131 Padova, Italy
62
Aix-Marseille Université, CNRS/IN2P3, CPPM, Marseille, France
63
Space Science Data Center, Italian Space Agency, Via del Politecnico snc 00133 Roma, Italy
64
School of Physics, HH Wills Physics Laboratory, University of Bristol, Tyndall Avenue, Bristol BS8 1TL, UK
65
Max Planck Institute for Extraterrestrial Physics, Giessenbachstr. 1 85748 Garching, Germany
66
Institute of Theoretical Astrophysics, University of Oslo, P.O. Box 1029 Blindern 0315 Oslo, Norway
67
Jet Propulsion Laboratory, California Institute of Technology, 4800 Oak Grove Drive, Pasadena, CA 91109, USA
68
Department of Physics, Lancaster University, Lancaster LA1 4YB, UK
69
Felix Hormuth Engineering, Goethestr. 17 69181 Leimen, Germany
70
Technical University of Denmark, Elektrovej 327 2800 Kgs. Lyngby, Denmark
71
Cosmic Dawn Center (DAWN), Denmark
72
Institut d’Astrophysique de Paris, UMR 7095, CNRS, and Sorbonne Université, 98 bis boulevard Arago 75014 Paris, France
73
Max-Planck-Institut für Astronomie, Königstuhl 17 69117 Heidelberg, Germany
74
NASA Goddard Space Flight Center, Greenbelt, MD 20771, USA
75
Department of Physics and Helsinki Institute of Physics, Gustaf Hällströmin katu 2 00014 University of Helsinki, Finland
76
Université de Genève, Département de Physique Théorique and Centre for Astroparticle Physics, 24 quai Ernest-Ansermet CH-1211, Genève 4, Switzerland
77
Department of Physics, P.O. Box 64 00014 University of Helsinki, Finland
78
Helsinki Institute of Physics, Gustaf Hällströmin katu 2, University of Helsinki, Helsinki, Finland
79
Laboratoire d’etude de l’Univers et des phenomenes eXtremes, Observatoire de Paris, Université PSL, Sorbonne Université, CNRS, 92190 Meudon, France
80
SKA Observatory, Jodrell Bank, Lower Withington, Macclesfield, Cheshire SK11 9FT, UK
81
Centre de Calcul de l’IN2P3/CNRS, 21 avenue Pierre de Coubertin 69627 Villeurbanne Cedex, France
82
Dipartimento di Fisica “Aldo Pontremoli”, Università degli Studi di Milano, Via Celoria 16 20133 Milano, Italy
83
, Via Celoria 16 20133 Milano, Italy
84
Universität Bonn, Argelander-Institut für Astronomie, Auf dem Hügel 71 53121 Bonn, Germany
85
INFN-Sezione di Roma, Piazzale Aldo Moro, 2 – c/o Dipartimento di Fisica, Edificio G. Marconi 00185 Roma, Italy
86
Dipartimento di Fisica e Astronomia “Augusto Righi” – Alma Mater Studiorum Università di Bologna, Via Piero Gobetti 93/2 40129 Bologna, Italy
87
Department of Physics, Institute for Computational Cosmology, Durham University, South Road, Durham DH1 3LE, UK
88
Université Côte d’Azur, Observatoire de la Côte d’Azur, CNRS, Laboratoire Lagrange, Bd de l’Observatoire, CS 34229 06304 Nice cedex 4, France
89
Université Paris Cité, CNRS, Astroparticule et Cosmologie, 75013 Paris, France
90
CNRS-UCB International Research Laboratory, Centre Pierre Binétruy, IRL2007, CPB-IN2P3, Berkeley, USA
91
Institut d’Astrophysique de Paris, 98bis Boulevard Arago 75014 Paris, France
92
Institute of Physics, Laboratory of Astrophysics, Ecole Polytechnique Fédérale de Lausanne (EPFL), Observatoire de Sauverny, 1290 Versoix, Switzerland
93
Aurora Technology for European Space Agency (ESA), Camino bajo del Castillo, s/n, Urbanizacion Villafranca del Castillo, Villanueva de la Cañada 28692 Madrid, Spain
94
Institut de Física d’Altes Energies (IFAE), The Barcelona Institute of Science and Technology, Campus UAB, 08193 Bellaterra, (Barcelona), Spain
95
School of Mathematics, Statistics and Physics, Newcastle University, Herschel Building, Newcastle-upon-Tyne NE1 7RU, UK
96
DARK, Niels Bohr Institute, University of Copenhagen, Jagtvej 155 2200 Copenhagen, Denmark
97
Department of Physics and Astronomy, University of Waterloo, Waterloo, Ontario N2L 3G1, Canada
98
Perimeter Institute for Theoretical Physics, Waterloo, Ontario N2L 2Y5, Canada
99
Centre National d’Etudes Spatiales – Centre spatial de Toulouse, 18 avenue Edouard Belin 31401 Toulouse Cedex 9, France
100
Institute of Space Science, Str. Atomistilor, nr. 409 Măgurele, Ilfov 077125, Romania
101
Consejo Superior de Investigaciones Cientificas, Calle Serrano 117 28006 Madrid, Spain
102
Universidad de La Laguna, Departamento de Astrofísica, 38206 La Laguna, Tenerife, Spain
103
Dipartimento di Fisica e Astronomia “G. Galilei”, Università di Padova, Via Marzolo 8 35131 Padova, Italy
104
Institut für Theoretische Physik, University of Heidelberg, Philosophenweg 16 69120 Heidelberg, Germany
105
Institut de Recherche en Astrophysique et Planétologie (IRAP), Université de Toulouse, CNRS, UPS, CNES, 14 Av. Edouard Belin 31400 Toulouse, France
106
Université St Joseph; Faculty of Sciences, Beirut, Lebanon
107
Departamento de Física, FCFM, Universidad de Chile, Blanco Encalada 2008, Santiago, Chile
108
Institut d’Estudis Espacials de Catalunya (IEEC), Edifici RDIT, Campus UPC, 08860 Castelldefels, Barcelona, Spain
109
Satlantis, University Science Park, Sede Bld 48940, Leioa-Bilbao, Spain
110
Institute of Space Sciences (ICE, CSIC), Campus UAB, Carrer de Can Magrans, s/n 08193 Barcelona, Spain
111
Instituto de Astrofísica e Ciências do Espaço, Faculdade de Ciências, Universidade de Lisboa, Tapada da Ajuda 1349-018, Lisboa, Portugal
112
Cosmic Dawn Center (DAWN), Denmark
113
Niels Bohr Institute, University of Copenhagen, Jagtvej 128 2200 Copenhagen, Denmark
114
Universidad Politécnica de Cartagena, Departamento de Electrónica y Tecnología de Computadoras, Plaza del Hospital 1 30202 Cartagena, Spain
115
INFN-Bologna, Via Irnerio 46 40126 Bologna, Italy
116
Infrared Processing and Analysis Center, California Institute of Technology, Pasadena, CA 91125, USA
117
INAF, Istituto di Radioastronomia, Via Piero Gobetti 101 40129 Bologna, Italy
118
Department of Physics, Oxford University, Keble Road, Oxford OX1 3RH, UK
119
ICL, Junia, Université Catholique de Lille, LITL, 59000 Lille, France
⋆⋆ Corresponding author: This email address is being protected from spambots. You need JavaScript enabled to view it.
Received:
28
March
2025
Accepted:
28
May
2025
Abstract
Euclid is delivering optical and near-infrared imaging data over 14 000 deg2 on the sky at spatial resolution and surface brightness levels that can be used to understand the morphological transformation of galaxies within groups and clusters. Using the Early Release Observations (ERO) of the Perseus cluster, we demonstrate the capability offered by Euclid in studying the nature of perturbations for galaxies in clusters. Filamentary structures are observed along the discs of two spiral galaxies, UGC 2665 and MCG +07-07-070, with no extended diffuse emission expected from tidal interactions at surface brightness levels of ∼30 mag arcsec−2. The detected features exhibit a good correspondence in morphology between optical and near-infrared wavelengths, with a surface brightness of ∼25 mag arcsec−2, and the knots within the features have sizes of ∼ 100 pc, as observed through IE imaging. Using the Euclid, CFHT, UVIT, and LOFAR 144 MHz radio continuum observations, we conducted a detailed analysis to understand the origin of the detected features. We constructed the Euclid IE−YE, YE−HE, and CFHT u − r, g − i colour-colour plane and show that these features contain recent star formation events, which are also indicated by their Hα and NUV emissions. Euclid colours alone are insufficient for studying stellar population ages in unresolved star-forming regions, which require multi-wavelength optical imaging data. There are features with red colours that can be explained by dust being stripped along with the gas in these regions. The morphological shape, orientation, and mean age of the stellar population, combined with the presence of extended radio continuum cometary tails can be consistently explained if these features formed during a recent ram-pressure stripping event. This result further confirms the exceptional qualities of Euclid in the study of galaxy evolution in dense environments.
Key words: galaxies: clusters: intracluster medium / galaxies: evolution / galaxies: spiral / galaxies: star formation
This paper is published on behalf of the Euclid Consortium.
© The Authors 2025
 Open Access article, published by EDP Sciences, under the terms of the Creative Commons Attribution License (https://creativecommons.org/licenses/by/4.0), which permits unrestricted use, distribution, and reproduction in any medium, provided the original work is properly cited.
This article is published in open access under the Subscribe to Open model. This email address is being protected from spambots. You need JavaScript enabled to view it. to support open access publication.
1. Introduction
Star-forming galaxies in the Universe follow a tight relation between the star-formation rate and the stellar mass, which has been observed to be present from redshift z ∼ 6 to 0 Brinchmann et al. 2004; Salim et al. 2007; Noeske et al. 2007; Elbaz et al. 2007; Daddi et al. 2007; Popesso et al. 2023. The existence of this relation since early epochs suggests that the process of gas condensation and star formation is well-regulated and closely tied to the galaxy’s gravitational potential well. Primarily, star-forming galaxies have spiral morphologies, where gas stabilises and collapses to form new star-forming regions in the disc, a process regulated by the availability of atomic and molecular hydrogen Kennicutt & Evans 2012. In dense environments, including galaxy clusters and groups, external processes such as galaxy mergers, starvation, thermal evaporation, ram-pressure stripping, and tidal interaction with the cluster potential can alter the gas content and star formation process (see for reviews Boselli & Gavazzi 2006, 2014; Cortese et al. 2021). When galaxies fall into galaxy clusters for the first time, they can experience mergers on the outskirts that disrupt their gas and stellar content, potentially triggering a starburst episode that rapidly depletes fuel for regulated star formation Barnes & Hernquist 1992; Barnes 2004. The cluster environment can cut off the gas supply to galaxies, leading to a gradual reduction of star formation, known as starvation, which slows down the star formation rate once the galaxy becomes a satellite of a larger halo Larson et al. 1980. The cluster potential can create perturbations to galaxies and even disrupt low-mass galaxies falling in radial orbits close to the cluster centre Valluri 1993; Moore et al. 1996; Mastropietro et al. 2005. The cold interstellar medium (ISM) of a galaxy can interact with the surrounding hot intracluster medium (ICM), leading to thermal evaporation Cowie & Songaila 1977. Ram-pressure stripping (RPS) can remove gas from the disc of an infalling gas-rich spiral galaxy, dragging its interstellar medium into the surrounding intergalactic medium Gunn & Gott 1972; Boselli et al. 2002. This process can be observed in the form of stripped tails in CO, radio continuum, H I, dust, Hα, and X-rays Gavazzi et al. 2001; Vollmer et al. 2004; Kenney et al. 2004; Sun et al. 2006; Chung et al. 2009; Yagi et al. 2010; Merluzzi et al. 2013; Fumagalli et al. 2014; Abramson et al. 2016; Jáchym et al. 2017; Moretti et al. 2018; Poggianti et al. 2019; Roberts et al. 2021a,b; Ignesti et al. 2022. The trajectory of the infalling galaxy, its properties, and those of the cluster determine whether these processes act alone or jointly. Gullieuszik et al. 2020; Smith et al. 2022.
Hydrodynamical processes such as RPS act only on the diffuse components of the ISM (gas, dust), leaving the stellar component unaffected. They can easily be identified whenever the tails of stripped material do not contain stars. Indeed, several examples exist of stripped tails of cold, ionised, or hot gas without any associated stellar emission
Gavazzi et al. 2001; Boselli et al. 2016; Boissier et al. 2012; Yagi et al. 2007, 2010, 2017; Jáchym et al. 2017; Laudari et al. 2022; Serra et al. 2023. However, under specific and still unclear physical conditions Boselli et al. 2022, star formation can occur in the tails of stripped gas Owen et al. 2006; Cortese et al. 2007; Smith et al. 2010; Owers et al. 2012; Ebeling et al. 2014; Fumagalli et al. 2014; Rawle et al. 2014; Poggianti et al. 2016, 2019; Bellhouse et al. 2017; Gullieuszik et al. 2017; Boselli et al. 2018; George et al. 2018, 2023; Poggianti et al. 2025; George et al. 2025. Mixing the cold ISM with the hot ICM is expected to warm up the cold gas component, preventing its collapse into giant molecular clouds, where star formation occurs. The occurrence of star formation in the stripped tail is intriguing, as it takes place outside the galaxy disc within the very hostile environment of a hot ICM, with a temperature of 107 − 8 K Sarazin 1986. Within the stripped tails, spectacular trails form, and star formation progresses as the galaxy moves within the cluster. The nearly face-on or edge-on orientation of the in-falling galaxy can make the star formation in the stripped tails appear to have a different morphology. The smallest scales at which star formation progresses in these regions, as well as their diffuse extent, can set constraints on the nature of gas collapse within the stripped tails Portegies Zwart et al. 2010; Elmegreen 2010; Elmegreen et al. 2014. To understand the size distribution of star-forming knots in the stripped gas at the faintest levels and the star-forming process in this hostile environment, it is necessary to observe star-forming regions at high spatial resolution and low surface brightness. High-resolution optical imaging of RPS galaxies can resolve knots of star formation in the stripped tails at 50–100 pc scales in nearby galaxy clusters Abramson & Kenney 2014; Kenney et al. 2015; Cramer et al. 2019; Boselli et al. 2021; Giunchi et al. 2023a; Gullieuszik et al. 2023; Waldron et al. 2023; Giunchi et al. 2025.
The recently launched Euclid mission, with its  spatial resolution in IE, can resolve these knots at 50 pc scales up to distances of 72.5 Mpc (z ∼ 0.016). Perseus (Abell 426) is a massive galaxy cluster (r200 = 2.2 Mpc, M200 = 1.2 × 10¹⁵ M⊙, velocity dispersion = 1040 km s−1) located at a redshift of ∼0.0167 Aguerri et al. 2020; Cuillandre et al. 2025a. The core region of the Perseus cluster is exceptionally rich in early-type galaxies, with a strong deficiency in late-type systems Kent & Sargent 1983. The galaxy cluster is located very close to the Galactic plane (latitude −13 degrees). There are four known RPS galaxy candidates in the central regions of the Perseus cluster (MCG +07-07-070, UGC 2654, UGC 2665, and LEDA 2191078). These RPS candidates have been identified from the presence of cometary-shaped radio continuum tails at 144 MHz and from the peculiar, asymmetric morphology of the stellar disc seen in ground-based optical imaging Roberts et al. 2022. The Euclid satellite observed the Perseus cluster in optical (IE) and infrared (YE, JE, HE) bands as part of the Euclid Early Release Observations (ERO; Euclid Early Release Observations 2025) programme. Two of these galaxies (MCG +07-07-070 and UGC 2665) are included in the Euclid ERO field with near-simultaneous co-aligned imaging in the optical and near-infrared.
The goal of this paper is to demonstrate the possibility opened up by Euclid in studying galaxy evolution in dense environments. We demonstrate this through a study of star-forming regions in the tails and main bodies of the galaxies UGC 2665 and MCG +07-07-070, made possible by the high spatial resolution and low surface brightness regime of Euclid’s optical and near-infrared imaging observations. The dominant perturbing mechanism can be first established using Euclid imaging data. The features resulting from gravitational perturbations are diffuse and include shells, plumes, and tidal tails Bílek et al. 2020. On the other hand, those related to RPS are filamentary and clumpy, with a cometary shape, as expected from star formation in the stripped gas Boselli et al. 2022. The sensitivity to low surface brightness features, in addition to the angular resolution offered by Euclid, can be used to identify the dominant perturbing mechanism (gravitational or hydrodynamic), resolve the star-forming regions in the stripped material, and reconstruct their star formation history. Finally, our results demonstrate the capabilities of the Euclid Wide Survey (EWS) in detecting low surface brightness features around galaxies across a large region of the sky, enabling the study of galaxy evolution in different environments. The low surface brightness imaging data from EWS, which reaches 29.8 mag arcsec−2, will enable surface brightness limits necessary to identify any possible perturbations induced on the stellar component by gravitational perturbations, and thus determine the dominant perturbing mechanism in rich environments on large, statistically significant samples. In identifying galaxies undergoing an RPS event through morphological analysis of broadband imaging data, it is particularly important to note that the lack of any evident perturbation in the stellar distribution is crucial for ruling out gravitational perturbations.
Throughout the paper we adopt a standard flat ΛCDM cosmology with Ωm = 0.319 and H0 = 67 km s−1Mpc−1Planck Collaboration VI 2020. Magnitudes are in the AB system, and, in concordance with other Perseus ERO papers, we adopted a distance of 72 ± 3 Mpc to the Perseus cluster, where 1″ corresponds to 0.338 kpc Cuillandre et al. 2025a.
2. Data and analysis
Cuillandre et al. 2025b have presented details on Euclid ERO and data reduction optimised for preserving low surface brightness features. We used the data products generated as part of the Perseus cluster observations, which are described in detail in Cuillandre et al. 2025a. The Euclid visible imager (VIS) has a broad passband (IE) that covers the wavelength range 5500–9000 Å Cropper et al. 2014, 2016; Euclid Collaboration: Cropper et al. 2025. The near-infrared spectrometer and photometer (NISP) covers the wavelength range 9200–20 000 Å using the YE, JE, HE passbands Maciaszek et al. 2014, 2016; Euclid Collaboration: Jahnke et al. 2025. Observations were taken centred on coordinates RA = 03h18m40s, Dec = 41° 39′00″ with a ∼0.7 deg2 field of view. The Perseus imaging from ERO was created by combining four reference observation sequences (ROS), whereas the EWS will consist of one ROS Euclid Collaboration: Scaramella et al. 2022; Euclid Collaboration: Mellier et al. 2025. The final combined image exposure time is 7456 s in the IE filter and 1392.2 s in the YE, JE, and HE filters. Euclid VIS and NISP imaging data have pixel scales of 0.1 arcsec pix−1 and 0.3 arcsec pix−1, with angular resolutions of  and
and  , respectively. This enabled us to achieve resolved spatial scales of ∼54 pc in VIS and 135 pc in NISP imaging observations of the stripped tails. The limiting surface brightness of the Perseus cluster field is 30.1 mag arcsec−2 in IE, 29.1 mag arcsec−2 in YE, 29.2 mag arcsec−2 in JE, and 29.2 mag arcsec−2 in HE for a 10″ × 10″ scale at 1σ Cuillandre et al. 2025a.
We used the optical broadband u, g, r, i, z photometry and narrowband Hα imaging data of the Perseus cluster field taken with the Canada France Hawaii Telescope (CFHT) before the Euclid launch. Details on the CFHT observations, data analysis, and image quality for all the bands are given in Cuillandre et al. 2025a. The image quality of CFHT band images varies between u , g
, g , r
, r , i
, i , z
, z , and Hα
 . The narrowband Hα ‘off’ filter (CFHT ID 9604), centred on λc = 6719 Å, has a width of δλ = 109 Å, which corresponds to a heliocentric velocity range of 4660–9600 km s−1 and is used for Hα observations. We created the Hα stellar continuum-subtracted (pure Hα+N II emission) image by subtracting with the r band image of the field.
We used the archival data of Perseus cluster observed using the Ultra-Violet Imaging Telescope (UVIT) onboard AstroSat Agrawal 2006; Tandon et al. 2017. The level 2 data were generated using the latest version (7.0.1) of the UVIT pipeline Joseph et al. 2025. The observations are in the far ultraviolet [FUV; filter F154W: λmean = 1541 Å, δλ = 380 Å. integration time = 11099 s], and the near ultraviolet [NUV; filter N245M: λmean = 2447 Å, δλ = 280 Å, integration time = 10966.4 s]. The UVIT NUV imaging was performed using a narrowband filter at  , compared to the FUV imaging done with a broadband filter at
  resolution. We used NUV N245M imaging in the analysis as it offers a better resolution than FUV Tandon et al. 2017, 2020.
We used the LOw Frequency ARray (LOFAR) 144 MHz observations of Perseus cluster field for radio continuum emission from the galaxies. These observations were taken as part of LOFAR Two-metre Sky Survey Shimwell et al. 2017, 2019. The LOFAR 144 MHz image covers the central ∼2° × 2° of the Perseus cluster field, with a resolution of 6″ and an RMS of 100 μJy/beam. The details of the LOFAR data reduction and analysis are presented in Roberts et al. 2022; van Weeren et al. 2024.
We note that the data from other wavelengths are at different spatial resolution and relative depths. Comparisons of observations from different instruments and wavelengths can be biased by this sensitivity issue, especially when using Euclid’s low surface brightness optimized imaging. This makes it difficult to quantitatively compare the details of the galaxies at low surface brightness between different wavelengths.
We used stellar masses derived from the spectral energy distribution fitting over the u, g, r, i, z, IE, YE, JE, and HE photometry, using the hyperz code Bolzonella et al. 2000, 2010. The effective radius is measured from the surface brightness profile using AutoProf/AstroPhot. Details of the derivation of these quantities are given in Cuillandre et al. 2025a.
A colour composite image of UGC 2665 and MCG +07-07-070 made from IE, YE, and HE band is given in Figs. 1 and 2.
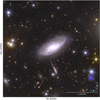 |
Fig. 1. Colour-composite image of the UGC 2665 galaxy created by combining and assigning blue, green, and red colours for IE, YE, and HE imaging data. The direction to the cluster centre is shown with a light magenta-coloured arrow. In the bottom right of the image, the blue patch is an artefact caused by dichroic ghost in IE imaging. |
3. Results
3.1. Identifying the dominant perturbing mechanism: Gravitational or ram-pressure stripping
Galaxies infalling into rich clusters can undergo gravitational interactions with the cluster potential as well as with other galaxies in the immediate vicinity. The gravitational interactions cancreate tidal features that form tails, shells, and plumes around the galaxies (see galaxy images in Bílek et al. 2020, 2022). These features, however, are normally very diffuse, with low surface brightness, formed from the stars that are tidally pulled out of the galaxies over a large region. On the other hand, RPS is a purely hydrodynamic process in which the gas is first stripped, sometimes appearing as filamentary cometary structures with or without clumpy and compact regions, where new episodes of star formation can occur (see Poggianti et al. 2016, 2019; Durret et al. 2021). We examine the primary mechanism responsible for the features observed in the case of two galaxies, using imaging observations from Euclid and the associated data products generated as part of ERO observations of the Perseus cluster.
3.1.1. Gravitational interaction with the whole cluster
The galaxy cluster can exert gravitational perturbations on infalling galaxies. The constituent matter of a radially infalling galaxy is subjected to the internal acceleration of the galaxy itself (agal), and the two components of the acceleration from galaxy cluster potential: the radial acceleration (arad cluster), the gradient of which tends to enhance the elongation of a galaxy along the galaxy-galaxy cluster direction, and the generally much weaker transverse acceleration (atrans cluster), the gradient of which tends to contract a galaxy in the perpendicular directions Henriksen & Byrd 1996. When the cluster arad cluster overcomes the agal, the perturbation can remove matter from the galactic disc. We compute the radial acceleration arad cluster exerted by the cluster on the galaxies using the following equation Henriksen & Byrd 1996,
![Mathematical equation: $$ \begin{aligned} a_{\rm rad\,cluster}=M(r)\;G\;[1/r^{2} - 1/(R+r)^{2}].\; \end{aligned} $$](/articles/aa/full_html/2025/09/aa54836-25/aa54836-25-eq12.gif) (1)
(1)
The mass of the cluster within the radius r, M(r), where r is the distance of the galaxy from the cluster centre, is computed using a concentration parameter c = 6 and a Navarro–Frenk–White radial density profile Navarro et al. 1997, as described in Eq. (9) of Boselli et al. 2022. G is the gravitational constant. We adopt the position of NGC 1275, the central type-D giant elliptical galaxy, as the centre of the Perseus cluster Roberts et al. 2022. UGC 2665 is observed to be located at a projected distance of 183 kpc from the centre of the cluster (0.10 r200) with a velocity offset ∼2441 km s−1 from the Perseus cluster redshift. MCG +07-07-070 is also found very close to the cluster centre, with a projected distance of ∼220 kpc (0.12 r200) and a velocity offset with respect to the cluster ∼1618 km s−1Roberts et al. 2022. The proximity of both galaxies to the cluster centre, along with their high-velocity offsets relative to the cluster, suggests that they were recently accreted and are likely experiencing their first infall. Table 1 gives details on the two galaxies in the Perseus cluster taken from Cuillandre et al. 2025a. We used the distance from the cluster centre (r), the effective radius (Re) given in Table 1 and the dynamical mass of the Perseus cluster at location of galaxy M(r) to compute the arad cluster using Eq. (1). We computed agal of the galaxy using the following equation,
Details on the two galaxies undergoing RPS in the Perseus cluster.
 (2)
(2)
The dynamical mass of the galaxy (mdyn) is estimated using the M⋆ values given in Table 1. We used the method described in Behroozi et al. 2013 where the halo mass versus stellar mass/halo mass relation can be used to compute the median stellar mass for a given halo mass. We note that the inverse of which does not give the average halo mass for a given stellar mass because of the scatter in the relation. Our goal is to get a rough estimate of the mdyn of the galaxy from the M⋆. We therefore computed the mdyn by considering the 0.01 dex scatter on the M⋆/mdyn and put a lower and upper limit for the mdyn. Within these limits we discuss whether the gravitational effects dominate over hydrodynamic effects on these galaxies. The UGC 2665 has mdyn ∼ 40 M⋆ (lower limit ∼ 29 M⋆, upper limit ∼ 67 M⋆), and the MCG +07-07-070 has ∼12.5 M⋆ (lower limit ∼ 11 M⋆, upper limit ∼ 14 M⋆).
When arad cluster/agal > 1, the cluster potential can create gravitational perturbations able to remove matter from the infalling galaxy. The computed arad cluster/agal values for both galaxies are given in Table 2. We should consider these values as upper limits, as we used projected distances from the centre of the cluster to compute arad cluster. Both galaxies are found to have agal greater than arad cluster. The cluster potential may have a greater effect on MCG +07-07-070, which has a slightly lower mass than UGC 2665. The truncation radius (Rtrunc), beyond which matter can be removed by the cluster potential, was computed for both galaxies as given in Binney & Tremaine 2008,
Computed details on gravitational and hydrodynamical effects on two galaxies.
![Mathematical equation: $$ \begin{aligned} R_{\rm trunc}=r\;[m_{\rm dyn}/M(r)]^{1/3},\; \end{aligned} $$](/articles/aa/full_html/2025/09/aa54836-25/aa54836-25-eq14.gif) (3)
(3)
where r, M(r) from Eq. (1) and mdyn from Eq. (2). The truncation radius is ∼ 37 kpc for UGC 2665, while it is ∼14 kpc for MCG +07-07-070. The truncation radius might range in between 33 kpc < Rtrunc < 44 kpc for UGC 2665 and 13 kpc < Rtrunc < 14 kpc for MCG +07-07-070 considering the dispersion on the mdyn. The isophotal radius measured at 26 mag arcsec−2 from the IE image is 13.64 ± 0.01 kpc for UGC 2665 and 13.12 ± 0.01 kpc for MCG+07-07-070 Cuillandre et al. 2025a. The truncation radius values are larger than the isophotal radius of the galaxies (comparable to MCG+07-07-070 lower limit), implying that it is not possible for the cluster potential to pull out material from the galaxy.
3.1.2. Gravitational interaction with nearby companions
We searched in NASA/IPAC Extragalactic Database (NED)1 for any nearby galaxy that could have gravitationally interacted with these two objects. We search within an area covered by a circle with a 20 arcminute (∼405 kpc) radius centred on the galaxy and a velocity separation of 2000 km s−1 (∼2× velocity dispersion of Perseus). The galaxies are having spectroscopic redshift information from the catalogue of Kang et al. 2024 down to r-band apparent magnitude (rPetro, 0) ∼ 20.5. Stellar masses of the galaxies are taken from Cuillandre et al. 2025a. In the case of galaxy UGC 2665 (M⋆ = 1.78 × 10¹⁰ M⊙), 67 galaxies meet these criteria, with the nearest two galaxies being WISEA J031917.76+413839.6 (M⋆ = 3.64 M⊙ × 1010 M⊙) located at a projected distance of ∼ 40 kpc to the west with a velocity difference of δv = 1577 km s−1 and WISEA J031937.46+413758.3 (M⋆ = 1.48 M⊙ × 1010 M⊙), located at a projected distance of ∼40 kpc to the east with a velocity difference of δv = 831 km s−1. The two closest galaxies in velocity space are WISEA J031848.10+412622.8 (δv = 3 km s−1) located at a projected distance of ∼281 kpc and PUDG R24 (M⋆ = 3.91 × 10⁸ M⊙), (δv = 30 km s−1), an ultra diffuse galaxy at a projected distance ∼288 kpc Gannon et al. 2022. The radial acceleration exerted by the nearest object on the perturbed galaxy can be calculated using the same formalism discussed earlier in this section, as given in Eq. (1), but with the cluster mass replaced by the neighbouring galaxy mass and using the distance to the neighbour (r) and the effective radius of the galaxy (Re). We checked the arad neighbour/agal for all the neighbouring galaxies within the search radius of 405 kpc centred on UGC 2665 and found that the highest value is 0.004 which is negligible.
There are 131 galaxies that meet this criteria for MCG +07-07-070 (M⋆ = 2.14 × 10⁹ M⊙) with the nearest galaxy NGC 1281 (M⋆ = 5 × 10¹⁰ M⊙) located at a projected distance of ∼61 kpc with a velocity difference δv = 315.0 km s−1. The closest galaxy in velocity space is WISEA J031943.81+412725.1 (M⋆ = 1.26 × 10¹⁰ M⊙, δv = 2 km s−1), located at a projected distance of ∼276 kpc. We checked the arad neighbour/agal for all the neighbouring galaxies within the search radius of 405 kpc centred on MCG +07-07-070 and found that the highest value is 0.09. The values are much smaller when considering the nearest galaxy in velocity space. Additionally, we note that a high-velocity encounter with another nearby galaxy can only remove mass from a galaxy when the distance between them is shorter than the typical length of the tidal tail and the galaxy’s mass is ≥1.33× dynamical mass of the main galaxy Boselli et al. 2022. We could not detect any massive galaxies at the distances of the tail length to both galaxies. Given the high-velocity dispersion (1040 km s−1) of the cluster and the relatively high velocity of the galaxies, it is unlikely that the galaxies are undergoing gravitational interactions with other galaxies at the cluster centre that could lead to the observed features. Another possibility is that interactions with a group of galaxies can collectively perturb the galaxies. In velocity space, we searched for galaxies within a 20 arcmin radius centred on both galaxies, but we did not find any grouped systems that could have interacted with the galaxy. However, as discussed in Boselli et al. 2023, gravitational interactions between the galaxies could have occurred in the past, when they were falling into the cluster outskirts, potentially perturbing the stars and the ISM. Galaxies could have undergone preprocessing in groups and got dispersed while falling into the cluster Dressler et al. 2004. This can then help strip the gas efficiently as the galaxy moves to the denser regions of the ICM. We recall here that the ram-pressure scales with the square of the velocity of the galaxy times the density of the ICM. We cannot entirely dismiss the possibility of gravitational interactions from any of these neighbouring galaxies, and galaxy groups in the past, as well as from the faint nearby galaxies with no confirmed spectroscopic redshifts. The gravitational perturbations caused by other companions can combine with those due to the cluster potential well (galaxy harassment), making the perturbing process much more efficient Moore et al. 1996. There can be galaxies in the Perseus cluster that may be detected in Euclid imaging but are not listed in NED due to being beyond the magnitude limits of available spectroscopic surveys. Such galaxies can also exert gravitational influence. In the case of UGC 2665, this is relevant, since the galaxy that appears to be interacting from the southern direction does not have confirmed redshift information.
We then analysed the IE imaging data to identify signatures of gravitational interactions, such as tidal tails, shells, and plumes around the galaxies, as well as asymmetries on the galaxy disc. The colour composite images of the galaxies shown in Figs. 1 and 2 show several interesting details. The southern edge of the disc of UGC 2665 is consistent with a smooth stellar halo. In the case of MCG +07-07-070, there is diffuse emission extended along the end of the spiral arms. Isophotal analysis was performed on the IE images of the galaxies down to surface brightness levels of 30 mag arcsec−2. The isophotes generated for these levels are overlaid on the galaxy images in Figs. 3 and 4. The galaxy images are generally symmetric, suggesting that the underlying population that contributes to the bulk of the galaxy’s stellar mass is not perturbed. The contamination from neighbouring stars and galaxies creates artefacts that appear as connections in the surface brightness levels. In the case of UGC 2665, there is a connection with the galaxy in the south as shown in Fig. 3. There are features emanating from the disc of the galaxies likely due to RPS but there are no faint diffuse extended features expected from tidal interactions. Deep optical imaging is expected to reveal features from any gravitational interactions in the form of isophotal asymmetries for the galaxy disc Duc et al. 2015; Boselli et al. 2023. We note these features can be present below the surface brightness limits, as simulations suggest the presence of such features at very low surface brightness of 33 mag arcsec−2Mancillas et al. 2019. However, observations of a large sample of galaxies gathered with MegaCam at the CFHT demonstrate that tidal features are rare at a surface brightness limit below 27.5 mag arcsec−2Sola et al. 2022. The asymmetric structures seen in the images are mainly filamentary and clumpy with a cometary shape. As shown in Figs. 3 and 4, these features have gradual surface brightness variation and appear to be escaping from the stellar discs detected with a limiting surface brightness level of 30 mag arcsec−2 in theIE images.
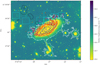 |
Fig. 3. Colour scale IE image of galaxy UGC 2665 with the scaling set to highlight faint stripped features at the galaxy outskirts. The features that are likely part of the stripped tail are marked with cyan boxes. Coloured contours overlaid on the image are for NUV N245M imaging data of the galaxy in blue, Hα in red and 144 MHz radio continuum in black. The NUV and Hα contour levels created for 2σ, 4σ and 6σ are shown. The contour levels created for 3σ, 6σ and 12σ from LOFAR image are shown. The direction of the stripping feature is marked with magenta-coloured arrows. White contours show isophote generated for surface brightness level of 30 mag arcsec−2. |
3.1.3. Ram pressure stripping
Ram-pressure stripping occurs when the hydrodynamic pressure exerted on the cold ISM of an infalling galaxy moving at a velocity (V) into a galaxy cluster with an ICM density (ρICM) surpasses the internal gravitational force holding the cold ISM to the galaxy disc. This can be expressed as
 (4)
(4)
where Σstar and Σgas represent the stellar and gas mass surface density. Following the mathematical formalism given in Boselli et al. 2022 we compute ρICM for the region around the two galaxies in the Perseus cluster. We used the radial variation of electron density (ne) in the Perseus cluster from Churazov et al. 2003 to estimate the (projected) value at the galaxy location (ne = 10−2 cm−3) within the cluster. Σstar and Σgas are computed for both galaxies within their effective radii using Eq. (20) of Boselli et al. 2022.
Since we do not have an estimate of the measured gas mass for the two galaxies, we used Eq. (25) from Boselli et al. 2022 to compute the total gas mass for each galaxy from the given stellar mass, using the luminosity-dependent XCO conversion factor provided in Boselli et al. 2022. The computed values of the ram pressure and the gravitational anchoring forces for two galaxies are given in Table 2. It is clear from Table 2 that ram pressure exceeds the gravitational anchoring of gas for both galaxies (UGC 2665 by a factor ∼61 and for MCG +07-07-070 by a factor ∼430). We caution that the location of the galaxies within the cluster (and hence the ICM density) is estimated based on the projected distance from the cluster centre. The ram-pressure computation provides an upper limit, which can decrease significantly depending on the true distance from the centre, where the ICM density is correspondingly lower.
3.1.4. Multi-frequency analysis
The 2σ, 4σ, and 6σ contours2 of NUV (blue) and Hα (red) are overlaid on both galaxies in Figs. 3 and 4. Both the NUV and Hα emission are due to the presence of recent star formation and follow the filamentary features seen in Euclid imaging. Roberts et al. 2022 presents the LOFAR 144 MHz radio continuum imaging of the two galaxies, which reveals the presence of extended, cometary tails extending from the galaxy disc. This low-frequency, non-thermal radio continuum is from synchrotron emission given off by cosmic ray electrons that were accelerated by supernova within the galaxy disc. We overlay the 3σ, 6σ and 12σ 144 MHz radio continuum contours (black) over the IE imaging of the two galaxies in Figs. 3 and 4. We note that the LOFAR imaging is at a lower spatial resolution of 6″ compared to the near-infrared, optical, and UV imaging presented here. The features detected from IE imaging of the two galaxies are almost co-aligned with the radio-continuum contours, with a slight displacement in the case of MCG +07-07-070.
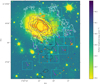 |
Fig. 4. Colour scale IE image of galaxy MCG +07-07-070 with the scaling set to highlight faint stripped features at the galaxy outskirts. Details are same as in Fig. 3. |
Contributions to radio continuum emission can come from physical mechanisms other than star formation van Weeren et al. 2019; Hardcastle & Croston 2020. These include past and recent activity from an active galactic nucleus (AGN) at the galaxy centre, as well as radio relics from recent mergers found within the galaxy cluster. The presence of an AGN can produce jets and create lobe-like features detectable in LOFAR 144 MHz radio continuum imaging. According to the WHAN diagram Cid Fernandes et al. 2011, which combines the equivalent width (EW) of the Hα emission line with the emission line ratio EW(N II)/EW(Hα), UGC2665 is classified as having a weak AGN, with an energy budget insufficient to produce jet/lobe-like features Meusinger et al. 2020. Another possibility is radio relics from cluster mergers that can be detected through radio continuum imaging. The orientation and appearance of the radio continuum contours are more likely to be associated with galaxies than with the cluster. The radio continuum emission is therefore associated with the stripped tails of the galaxy and traces cosmic ray electrons accelerated by supernovae. Cosmic ray electrons in the stripped tails can undergo synchrotron aging, characterised by a steep spectral index that can be flattened by the presence of star formation Roberts et al. 2022. The displacement of radio continuum contours from the features seen in IE imaging for MCG +07-07-070 can be explained by the detection of regions with steep spectral index in 144 MHz radio continuum imaging. The radio mini-halo detected around NGC 1275, the central cluster galaxy, at 144 MHz overlaps with UGC 2665, which can also contribute to radio continuum emission detected from the RPS tail of the galaxy Roberts et al. 2022.
The correspondence between the broadband optical emission from these features and the presence of a radio continuum tail strongly supports the RPS origin. First, the gas is stripped from the galaxy, forming extended tails where star formation occurs in situ, which is then visible as optical emission. The direction of the tails can indicate a ram-pressure origin, since galaxies falling into a cluster for the first time on radial orbits tend to have tails oriented opposite to their velocity vector. The orientation of the stripped tails can help in understanding the orbital dynamics of the galaxy within the cluster Smith et al. 2022; Salinas et al. 2024; George et al. 2024. However, this is complicated by the effect of galaxy rotation when moving at high speeds within the galaxy cluster environment.
3.1.5. Ram-pressure stripping as the dominant perturbing mechanism
In summary, we emphasise that the morphology of the features observed in Euclid imaging of both galaxies does not display any diffuse tidal tail or shells, which would be expected in recent gravitational perturbations, down to the limiting surface brightness of 30.1 mag arcsec−2 of Euclid IE (and similarly in the slightly shallower YE, JE, HE imaging). The features have a filamentary and clumpy structure, with a cometary shape, which is expected in star formation occurring in the tails of galaxies undergoing RPS. These features are extended and have a low surface brightness connection to the galaxy’s disc. In the case of MCG +07-07-070, the one-sided features from the galaxy’s disc resemble the fireballs detected in the stripped tails of galaxies in nearby clusters Yoshida et al. 2008; Hester et al. 2010; Yoshida et al. 2012; Smith et al. 2010; Kenney et al. 2014; Jáchym et al. 2014, 2019; Giunchi et al. 2023b. The two galaxies have also extended radio continuum tails of cometary shape that are co-aligned with the features detected in IE imaging. The radio continuum tails have the expected morphology of ram pressure stripping, where the stripped gas is displaced in the ICM, while the in situ formed stars are not affected. This is particularly clear in the case of MCG +07-07-070, where the radio continuum detected tail is displaced from the features detected through IE imaging. Galaxies experiencing their first infall should have stripped tails pointing away from the cluster centre, which can then be redirected towards the centre after a pericentre passage. We observe that the tail of UGC 2665 is oriented away from the cluster centre, whereas the tail of MCG +07-07-070 is oriented towards the cluster centre, as shown in Figs. 1 and 2. As demonstrated in Table 2, the location of both galaxies in the Perseus cluster is far enough from the centre to avoid gravitational perturbations from the cluster potential, and ram pressure dominates over the gravitational anchoring forces of the cold gas, which can potentially strip the gas. Theoretical arguments, supported by observational evidence from Euclid and multi-wavelength data from UVIT, CFHT Hα, and LOFAR, suggest that the two galaxies are currently experiencing a RPS event. Still, the effect of gravitational interactions in the past with other galaxies cannot be fully ruled out. Such an interaction can perturb the gas content of the galaxy, loosening the tightly bound disc gas, thereby making the RPS process more efficient Cortese et al. 2021.
3.2. Ram-pressure stripping in optical and near-infrared imaging
Having established the ram-pressure origin of the features seen in the Euclid imaging data of the two galaxies, we then conducted a combined analysis of the stripped tails of the galaxies using both optical (IE) and near-infrared (YE) imaging data. The colour composite images of the galaxies, created from optical and infrared imaging shown in Figs. 1 and 2, display filamentary dusty and stellar structures escaping from their stellar discs, similar to those observed in a few cluster objects with available HST data Kenney et al. 2015; Abramson et al. 2016; Cramer et al. 2019. Next we discuss the morphological features detected in the Euclid imaging for bothgalaxies.
UGC 2665 is a spiral galaxy, morphologically classified in NED as Scd, which lacks a bulge. The galaxy is observed almost edge-on, with a measured axis ratio of 0.444 from IE imaging, corresponding to an inclination of ∼64° Cuillandre et al. 2025a. The galaxy displays features suggesting star formation is occurring in the stripped tail, visible in an edge-on direction. There are features in the galaxy that are due to dust lanes. The dust lanes on the galaxy disc are visible in IE imaging, but not in YE and HE imaging, as shown in the colour composite image in Fig. 1. The dust present in the galaxy disc can also be stripped along with the gas. There are knots that appear to emanate from the spiral arms but are superimposed on the galaxy’s disc due to projection. The features outside the galaxy close to the disc are clumpy, elongated, and follow the direction of stripping.
Parameters used for SourceXtractor++ run of u, IE, YE, JE, HE images of the two galaxies.
The galaxy displays a distinct “unwinding” effect in the outer spiral arms of the disc, as shown in Fig. 5. This is an effect observed in several RPS galaxies in the literature, both in observations Bellhouse et al. 2021; Vulcani et al. 2022 and simulations Schulz & Struck 2001; Roediger et al. 2014; Steinhauser et al. 2016. To better visualise the effect of ram-pressure on the spiral arms of the galaxy, the IE image of the galaxy is reprojected into polar coordinates, with radial distance from the galaxys’ centre (r) and azimuthal angle around the disc (θ) in the plane of the galaxy. The galaxy is corrected for inclination using the axial ratio from IE imaging, by scaling the distances along the dimension of the minor axis. Each pixel is reprojected into polar coordinates according to its radial distance and azimuthal position. To preserve the area of each pixel in polar space, the reprojection is carried out for each corner of the pixel individually, mapping the shape of each pixel from a square in the cartesian image plane to a polygon in polar coordinates. This is particularly important in regions close to the galactic centre, where some pixels span a large range of azimuthal angles. The left panel of the figure shows the galaxy “unwrapped” in polar coordinates, whilst the right panel shows the original image. On the left-hand panel, logarithmic spiral arms have been drawn to highlight the prominent dust lanes. These spiral arms are shown reprojected back onto the galaxy disc on the right panel. The pitch angle (the angle between a spiral arm and the tangent to the circle on the plane of the disc) can be used as a measure of the tightness of the spiral arm. The pitch angle, ∼0, lies along the tangent, while 90° lies along the normal; tightly wound spiral arms have lower pitch angles, and steeper, more loosely wound spiral arms have higher pitch angles. The median pitch angle of the most prominent spiral arms in the galaxy is ∼22° within 2× the effective radius of the disc (marked by the dashed line/ellipse in Fig. 5), and ∼39° outside this radius. Higher pitch angles in the outer regions of the disc compared with the inner disc suggest that the spiral arms are effectively being unwound. In the trailing region of the galaxy’s disc, the spiral arms are extremely extended, and they become steeper towards the outskirts of the disc and tails. As demonstrated by simulations in Bellhouse et al. 2021, this is consistent with ram-pressure “unwinding” the gas component of the spiral arms. The stars formed in situ outside the galaxy’s disc exhibit a steeper pitch angle than those formed within the disc, yet still maintain the general shape of the spiral arms. The presence of this pattern further confirms the RPS operating in this galaxy. The pattern and amount of unwinding in this galaxy suggest that it is consistent with ram-pressure stripping, as seen in galaxies confirmed by integral-field spectroscopy, and that gravitational processes are not necessary to explain the curved tails. Furthermore, the presence of unwinding in this manner tells us that the galaxy is likely to be in an early stage of infall. According to Bellhouse et al. 2021, the visual unwinding stage is relatively short-lived, lasting up to 0.5 Gyr before the pattern is washed out by the ICM wind into the tail of the galaxy.
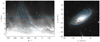 |
Fig. 5. Left panel: IE image of UGC 2665 galaxy “unwrapped” in polar coordinates in terms of radial distance from the centre of the galaxy (r) and azimuthal angle around the disc (θ). Right panel: Original image in greyscale. Logarithmic spiral arms have been drawn on the left-hand panel on the prominent dust lanes in cyan colour crosses. Spiral arms are shown projected back onto the galaxy disc on the right panel. |
The unique, low surface brightness optimised imaging data from Euclid allowed us to explore stripped tails at faint levels. We performed a morphological analysis of the low surface brightness features observed along the stripped tails using optical, near-infrared, and other wavelength imaging data. Euclid IE imaging of the galaxy is used to construct a surface brightness map, with features associated with stripping marked in cyan boxes, as shown in Figs. 3 and 4. The stripped features in boxes 1 to 10, marked on the IE and YE images, are shown in detail in Figs. 6 and 7. The RPS features seen in IE imaging are seen in YE imaging as well, though at a slightly lower spatial resolution. Figure 3 shows the overlaid contours of ultraviolet, Hα and 144 MHz radio continuum. The Hα emission clearly displays a stripping pattern, with the emission from the bright features outside the galaxy detected in IE imaging. Hα emission in star-forming regions is due to the recombination of hydrogen that is ionized by O and early-B stars with ages ≤ 10 Myr Kennicutt 1998; Kennicutt & Evans 2012. The NUV N245M contours appear to cover the detected features, suggesting the presence of very recent star formation (with ages ≤ 200–300 Myr) in the stripped tails. The NUV flux is coming from the photospheres of A–F spectral type stars with age ∼ 300 Myr Boselli et al. 2009. The Hα and NUV N245M regions exhibit a spatial correlation, indicating very recent star formation (less than 10 Myr) in these areas. We note that the Hα and NUV imaging is at a different depth compared to Euclid, and therefore, we do not make any claims about the features detected along the low surface brightness tails. Radio continuum contours clearly reveal the morphology of the gas in the galaxy’s disc and the intracluster medium, with prominent cometary tail features indicative of RPS. The feature highlighted in box 10 is the farthest from the disc and is likely associated with the RPS of the galaxy. Note that the bright streaks in box 10 are due to a foreground nearby bright star in the field. Diffuse emission and clumpy features are observed in the direction of stripping, prominently seen in boxes 1 to 10.
MCG +07-07-070 is a peculiar galaxy classified in NED as SBR(pec). The galaxy is seen face-on with a measured axis ratio of 0.721 from IE imaging that corresponds to an inclination of ∼43°. The stripped material in MCG +07-07-070 is oriented towards the centre of the cluster, as seen in projection, which suggests it may be moving away from the cluster centre after a recent pericentric passage. The features are marked in cyan boxes numbered 1 to 16 in the IE image of the galaxy, as shown in Fig. 4. The galaxy IE image is overlaid with Hα and 144 MHz radio continuum contours. The NUV N245M contours are confined to the galaxy’s disc in projection, as is the Hα, except for a few regions on the stripped tail ends. The faint features outside the disc of the galaxy do not show NUV N245M and Hα emission. The Hα morphology in the disc appears truncated with respect to that of the underlying stellar disc. Star-formation truncation is an aftereffect of RPS, where the outer disc gas is stripped, leaving the gas confined to the central regions, hosting star formation. Koopmann & Kenney 2004a,b; Koopmann et al. 2006; Boselli & Gavazzi 2006; Cortese et al. 2012; Fossati et al. 2013; Fritz et al. 2017; Vulcani et al. 2020. The RPS scenario is expected to cause a stronger truncation of Hα than NUV because the stripping occurs from the outside in. If there is an age effect, between 10 and 100 Myr after the start of the stripping, the Hα disc will be completely truncated, while the NUV disc will only be marginally affected Boselli & Gavazzi 2006. Mondelin et al. 2025 provide more details on the truncation occurring in these galaxies based on the ERO of the Perseus field. We note that MCG +07-07-070 Hα observations can be affected by the galaxy’s peculiar velocity, such that the Hα filter does not completely cover the emission line. Radio continuum contours show the cometary tail features expected from RPS and are slightly displaced from the features seen in IE imaging. The stripped features from the IE images are shown in detail in Fig. 8 and shown for the YE image in Fig. 9. The features exhibit a “fireball” structure (see Appendix for a description of this scenario), characterized by head clumps at the leading edge and diffuse emission at the trailing edge. The orientation of the stripping with respect to the line of sight likely explains this pattern, with the diffuse emission revealing the extent of star formation within the tails. The features marked with arrows in boxes 1, 2, 4, 5, 6, 7, 10, and 12 are not all parallel, as expected when the galaxy rotates while moving within the cluster. The stripped tail direction represents the composite vector of the stripping direction and the galaxy’srotation.
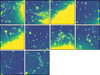 |
Fig. 6. Zoom-in on the IE imaging of stripped features for UGC 2665 galaxy. These correspond to the boxes marked in Fig. 3. Each box has a size of 5.1 kpc × 4.4 kpc with the arcsec bar shown corresponding to 338 pc at cluster frame. The details of markers are as in Fig. 3. Contours corresponding to the boundaries of the segments detected from IE image in section 3.3 are overlaid. |
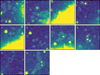 |
Fig. 7. Zoom-in on the YE band imaging of stripped features for UGC 2665 galaxy. These correspond to the boxes marked in Fig. 3. Each box has a size of 5.1 kpc × 4.4 kpc with the arcsec bar shown corresponding to 338 pc at cluster frame. The details of markers are the same as in Fig. 3. Contours corresponding to the boundaries of the segments detected from YE image in Section 3.3 are overlaid. |
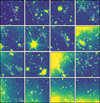 |
Fig. 8. Zoom-in on the IE imaging of stripped features for MCG +07-07-070. These correspond to the boxes marked in Fig. 4. Each box is having a size of 5.1 kpc × 4.4 kpc with the arcsec bar shown corresponding to 338 pc at cluster frame. The details of markers are the same as in Fig. 4. Contours corresponding to the boundaries of the segments detected from IE image in Section 3.3 are overlaid. |
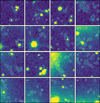 |
Fig. 9. Zoom-in on the YE band imaging of stripped features for MCG +07-07-070. These correspond to the boxes marked in Fig. 4. Each box has a size of 5.1 kpc × 4.4 kpc with the arcsec bar shown corresponding to 338 pc at cluster frame. The details of markers are the same as in Fig. 4. Contours corresponding to the boundaries of the segments detected from YE image in Section 3.3 are overlaid. |
In general, we detected the features seen in the IE imaging, albeit at a slightly lower resolution, in the YE imaging of the two galaxies. The near-infrared emissions from the galaxies are dominated by an old-evolved population of stars. However, this is not the case for stripped tails, which can include contributions from the stellar continuum of cool main-sequence stars and red supergiants that have recently left the massive end of the main sequence. We demonstrate this in the next section based on colour information derived from the Euclid optical and near-infrared imaging data. We note that the morphology of the optical and near-infrared detected features is very similar, with the peak emission from the knots coinciding.
3.3. Surface brightness of stripped features: Optical, near-infrared analysis
Euclid imaging is optimized for high angular resolution and low surface brightness, enabling the detection of a larger extent of features created by RPS. We detected these features with SourceXtractor++Bertin et al. 2020; Kümmel et al. 2022. This new and extended implementation of a source detection algorithm has the advantage of performing photometric measurements in multiple bands based solely on the World Coordinate System, unlike SExtractor2Bertin & Arnouts 1996, which requires alignment of all measurement images.
To compute the surface brightness of the stripped features, we made independent SourceXtractor++ runs on the IE, YE, JE, and HE images. Table 3 gives details on the parameters used for the run. As discussed in Cuillandre et al. 2025a, these ERO images have already had their backgrounds removed.
-
We verified that the images used in this analysis have a reasonable background subtraction in our regions of interest and decided not to perform additional background determination.
-
We used the associated weight image for detection and photometry in each band.
-
We optimized the detection result with the built-in detection filter [2.0 pixel full width half maximum (FWHM)].
-
We selected the detection threshold and minimum area in each band independently to keep the false positive detection rate low (< 1.0%). We note that this is different for the two galaxies in NISP bands.
The average surface brightness distribution of the stripped features were then computed using the auto_mag brightness, which is measured in an elliptical aperture derived from the object’s surface brightness distribution, and the segmentation area, which is the area above the detection threshold.
We utilised the segmentation map from the IE image, which is deeper than near-infrared images, to isolate the features associated with stripping. The features associated with stripping are identified by visually inspecting the segmentation map overlaid on the IE images of the two galaxies. These are the features that appear in the marked cyan boxes shown in Figs. 3 and 4. We note that this process is done visually and may leave behind faint, irregular, and distant galaxies, contaminating the detection of genuine features. We checked the possibility of contamination by computing the number density of objects within the limiting magnitude of the detected knots in IE, YE, JE, and HE band images of the galaxies. We calculated the number density, measured in objects/arcmin2, within the boxes marked along the tails of the galaxies in Figs. 3 and 4, as well as in a few regions away from the galaxy. The number density is found to be 3.6/2.2/2.2/1.9 times higher along the stripped tails of UGC 2665 and 4/3.16/2/2.1 times higher along the stripped tails of MCG +07-07-070 in IE/YE/JE/HE bands. This suggests that objects cluster along features in the boxes, which are very likely part of the stripped tails. However, a robust confirmation requires spectroscopic redshift information. We selected those features that show diffuse emission associated with stripping. We excluded stars and features that have the morphology of a likely background galaxy from the selection. After measuring the surface brightness of stripped features from IE images of the galaxies, we created segmentation maps for stripped tails independently using YE, JE, and HE imaging data. The distribution of surface brightness of the features is shown in Fig. 10. The limiting surface brightness of these features changes with the imaging band which in turn is dependent on the sensitivity of the imaging data. Table 4 gives the number of detected segments associated with the stripped features of the two galaxies.
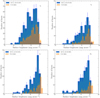 |
Fig. 10. Distribution of surface brightness of segments from the stripped tails detected from IE, YE, JE, HE images of UGC 2665 and MCG+07−07−070. Poisson errors are shown with an error bar. |
Number of the features detected independently from IE, YE, JE, HE images of the two galaxies.
Table 5 lists the surface brightness and corresponding area of the faintest feature detected for two galaxies. We note that the faintest features have a surface brightness of 25.17 mag arcsec−2 for MCG +07-07-070 and UGC 2665, as seen in IE imaging. The surface brightness changes to 25.17 mag arcsec−2 for MCG +07-07-070 and 25.36 mag arcsec−2 for UGC 2665 based on HE imaging data. To better understand the nature of the selected features, we provide the segmentation map of these features, detected independently from the IE imaging in Figs. B.1 and B.2 and at a NISP resolution in the YE imaging of the two galaxies in Figs. B.3 and B.4. We also overlay the contours corresponding to the boundaries of the segments in Figs. 6, 7, 8 and 9. Our goal here is to determine the faintest features that can be resolved within the stripped tails with Euclid imaging. This information can be used to plan for the study of stripped features from Euclid DR1 imaging data.
Surface brightness and the corresponding area of the faintest features detected from IE,YE,JE,HE images of the two galaxies.
3.4. Optical, near-infrared colour of the stripped features
We measured the Euclid colour of the low surface brightness clumpy features detected for the two galaxies. Measuring object colours in imaging data with large differences in resolution and pixel scales requires special attention. SourceXtractor++ projects the elliptical apertures determined on the detection image onto the other measurement images, measuring the brightness of the objects within. The image with the lowest resolution is used as the detection image, which allows the flux of each object to be measured in the same sky area for the better-resolved bands, thereby largely eliminating the impact of resolution on photometry. We used HE as the detection band to measure the colours of the stripped features in the Euclid bands.
We removed contamination from foreground stars after matching the position of knots with the Gaia DR3 catalogue of stars in the field. We note that the limiting magnitude for GaiaG is ∼ 21 in the regions of the galaxies, where the Perseus ERO has a point source depth with a 5σ PSF magnitude of 28.0, 25.2, 25.4, and 25.3 in IE, YE, JE, and HE, respectively and with the exceptional angular resolution in IE star complexes down to the scales of 50 pc can be resolved. This suggests that fainter stars may be present in these fields, detectable through Euclid imaging, which could potentially contaminate the detected features. The extinction due to MilkyWay in the direction of the galaxies is computed for each band using the procedure described in Cuillandre et al. 2025a. The colours computed for these features are then used to constrain the age of the underlying stellar population in the stripped tails. We quantify the resolved knots found in the low surface brightness features identified from the segmentation map. We consider these knots, which lack redshift information, to be in situ star-forming regions, as they fall on low surface brightness stripped features. Additionally, the regions are also covered by the emission detected through UVIT NUV narrowband imaging, as shown in Figs. 3 and 4.
The zoom-in IE images show that the
identified knots have diffuse emission associated with them in the direction of stripping. These knots are selected from the regions outside the galaxy in the direction of stripping. Knots that appear
to follow the stripping pattern are visible in projection, overlapping with the galaxy’s disc. This is particularly true of UGC 2665, and we exclude these knots from consideration due to their susceptibility to contamination from the galaxy’s disc flux. The selected knots on the stripped tails of the galaxies are used to construct a Euclid colour-colour diagram. Figures 11 and 12 show the colour-colour plots of the detected knots in UGC 2665 (green) and MCG +07-07-070 (grey), created using IE−YE, YE−HE, and YE−JE colour combinations. We only show the knots that exceed the resolution limit ( ) of the HE imaging data, with a 3σ detection. There are 37 knots detected for UGC 2665 and 138 knots detected for MCG +07- 07-070. The colour values for single stellar populations of ages ranging from 0 to 300 Myr were generated using Bruzual & Charlot 2003 stellar population models (BC03), Padova 94 isochrones, and a Kroupa initial mass function (IMF, Kroupa 2001), for solar metallicity, corresponding to a redshift of 0.01, are overlaid. The corresponding age range (< 300 Myr) is shown in the colour bar scale and the colour distribution of the knots is shown in the side panels. The measured flux from these knots can be affected by extinction due to dust within the system and in the foreground from the Galaxy. We performed MilkyWay extinction correction for the magnitude values, but the intrinsic extinction can affect these colour values plotted here. The modeled colour values for different stellar population ages exhibit non-monotonous behaviour, mainly because integrated stellar population colours shift to blue before the first massive stars become red supergiants (which takes about 10 Myr), then to the very red colours of red supergiant dominated populations, and later to slightly less red colours when these supergiants become less luminous. The rotation of massive stars also affects this, as it determines the coolest temperature a star of a given mass can reach, and additionally, the spectra of massive stars are uncertain. This makes it difficult to estimate the ages of the underlying stellar population from Euclid colour-colour plots alone. However, as we demonstrate here, we can determine whether the colours are compatible with a young age across an age/metallicity range. The IE bandpass covers a broad wavelength range, which is sensitive to spectral energy variations for different stellar population ages. We could effectively discriminate the contribution of different age stellar populations to the spectral energy distribution by using u, g, i, z imaging data. The resolution of the CFHT data is lower than that of the Euclid imaging data. We used the u band image with the lowest resolution of
  for detection and identification of the knots. We applied the segmentation map to the g, r, i, and z imaging data of both galaxies after running SE++ on the u band imaging data using the parameters given in Table 3. There are 11 knots detected for UGC 2665 and 39 knots detected for MCG +07-07-070 that coincide with the regions seen in the Euclid imaging. The magnitudes are measured and corrected for MilkyWay extinction. The u − r, g − i plot of the detected knots for UGC 2665 (in green) and MCG +07-07-070 (in grey) are shown in Fig. 13. The colour values for single stellar population ages for u − r, g − i colours over the range 0–1000 Myr are overlaid. Most knots have colours consistent with hosting recent star formation, but a few have red colours. There can be several reasons for this behaviour of the detected knots such as source contamination and flux attenuation due to dust. CFHT ground-based imaging of these knots can be contaminated by background or foreground sources.Dust at the stripped tail sites, where these knots are located, can weaken blue band (u and g) flux, leading to a strong degeneracy when interpreting the ages of the underlying stellar population. We examined how colours change due to dust extinction in the models we used in Figs. 11, 12, and 13 assuming Av = 1 mag (median value of Av = 0.5 mag along the stripped tails of GASP galaxies Poggianti et al. 2019), and the extinction law of Cardelli et al. 1989 with Rv = 3.1 for full range of solar metallicity model colours. The differential extinction values for different colours are sufficiently close to be represented by a single vector in the figures. E(IE−YE) = 0.42 for the bluest model and 0.35 for the reddest model, E(YE−HE) = 0.20 over the full range of model colours, E(YE−JE) = 0.115 over the full range of model colours, E(u − r) has a non-monotonic behaviour as a function of (u − r) but stays between 0.685 and 0.705. E(g − i) = 0.56 for the bluest model and 0.50 for the reddest model. We note that the adopted extinction does not explain the dispersion in the Euclid colour plots. We note that we haven’t included the nebular emission in our models, which can explain quite a part of the dispersion seen in Euclid colour plots. Detailed modelling of the dust content and nebular emission is required to understand the true nature of the underlying stellar population in these knots.
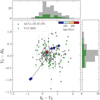 |
Fig. 11. Colour-colour plot of the detected knots created using IE−YE, YE−HE colour combination for UGC 2665 and MCG +07-07-070. We show the colour of the low surface brightness features detected from the segmentation map over the stripped tails of the galaxies. The colour values for different single stellar population ages generated using BC03 stellar population models, Padova 94 isochrones, and Kroupa IMF for solar metallicity are shown in filled circles connected with dotted line. The corresponding age is shown in the colour-bar scale. The IE−YE and YE−HE colour distribution of the knots are shown in side panels. |
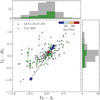 |
Fig. 12. Colour-colour plot of the detected knots created using YE−JE, YE−HE colour combination for UGC 2665 and MCG +07-07-070. Details are same as in Fig. 11. |
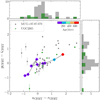 |
Fig. 13. Colour-colour plot of the detected knots created using u − r, g − i colour combination for UGC 2665 and MCG +07-07-070. Details are same as in Fig. 11. |
3.5. The smallest knots detected in the stripped tails
We demonstrate Euclid’s capability to detect small-scale knots in the tails of RPS galaxies using higher resolution optical IE imaging. The high spatial resolution imaging enables small-size knots to be detected within the stripped tails, which can be used to determine the smallest scales at which gas collapses in the stripped tails. Young, hot stars in star-forming complexes ionise dense molecular clouds, creating H II regions with typical sizes of ∼0.01–1000 pc, found in both Galactic and extragalactic environments Hunt & Hirashita 2009. We perform source detection using SExtractor2 which is applied on a ring-filtered IE frame (with inner and outer radii of 4 and 8 pixels) Bertin & Arnouts 1996. We used the following parameter values, DETECT_MINAREA = 3, DETECT_THRESH = 1.5, ANALYSIS_THRESH = 1.5, DEBLEND_NTHRESH = 32, and DEBLEND_MINCONT = 0.0005 for the SExtractor2 run on the IE images of the galaxies. We performed aperture photometry for the detected sources using photutils, with an aperture diameter of four times the FWHM of the PSF, which was about 7 pixels in all the filters. The aperture magnitudes were corrected for the fraction of the light beyond the aperture. Additionally, the background was estimated for an annulus around each object with an inner diameter of 10 times the FWHM of PSF and a thickness of 20 pixels. We selected the knots at the resolution limit ( ) that fall on the low surface brightness features within the boxes overlaid in Figs. 3 and 4. We show only the detected knots at the resolution limit of the IE imaging data. These knots are unresolved and have an upper size limit of
  ∼ 108 pc. The IE magnitudes detected from the tails of UGC 2665 (in orange) and MCG +07-07-070 (in blue) are shown in Fig. 14. There are 42 knots for UGC 2665 and 46 knots for MCG +07-07-070. The detected knots are of size ≤ 108 pc with a limiting magnitude of 27.8 mag for UGC 2665 and 30.2 mag for MCG +07-07-070. It is worth noting that, at these faint magnitudes, contamination from foreground stars is possible, and the true nature of these knots associated with the stripped tails remains to be fully established. Eight knots in UGC 2665 and five in MCG +07-07-070 have Hα emission associated with them, but none show any NUV emission. The reason we fail to detect all these knots in NUV and Hα may be that Euclid is more sensitive to faint features than UVIT/CFHT and has a higher angular resolution, which is crucial for avoiding flux dilution of point sources such as those analysed in this work. Similar-sized star-forming knots (50–100 pc) have been reported in the tails of RPS galaxies in the Coma and Virgo clusters Cramer et al. 2019; Boselli et al. 2021.
 |
Fig. 14. Distribution of the magnitudes of smallest knots detected from IE image of UGC 2665 and MCG+07−07−070. Poisson errors are shown with an error bar. |
Euclid’s exceptional angular resolution enables identification of star-forming complexes as small as 108 pc at the distance of the Perseus cluster, providing further insight into the impact of perturbation on the stripped material in two galaxies. Figure 11 reveals a significant limitation in studying the physical properties of these features at high spatial resolution and low surface brightness levels: the broadband filters of Euclid are insufficient to identify the dominant stellar population and determine the age.
4. Discussion
The Euclid optical and near-infrared imaging of the Perseus cluster field reveals that RPS is the dominant perturbing mechanism for galaxies UGC 2665 and MCG +07-07-070. The cometary-shaped features with clumps likely host star-forming knots in the stripped tails outside the galaxies, as observed in the low surface brightness optimized IE, YE, JE, HE imaging data. Both galaxies show cometary tails in low-frequency radio continuum imaging observations. These tails have a morphology expected from RPS. In the case of UGC 2665, dust lanes are visible on the galaxy’s disc in IE imaging, but they almost disappear in the YE imaging data. This galaxy’s appearance is very similar to that of NGC 4522, another object in the Virgo cluster undergoing RPS and hosting dust lanes Kenney & Koopmann 1999. The dust lane features resemble those observed in the HST imaging of spiral galaxy NGC 4921, which is undergoing RPS in the Coma cluster, as seen at high angular resolution Kenney et al. 2015. The dust lanes appear to follow the stripping pattern, suggesting that dust has been stripped away with the gas, as observed in other galaxies in Virgo and Coma galaxy clusters Abramson et al. 2016; Longobardi et al. 2020. As dust and gas are well mixed within the ISM, they can be removed together during the hydrodynamic interactions experienced due to RPS. The dust lanes in the disc of the galaxy UGC 2665 follow the spiral arms, which appear to have an unwinding pattern in the direction of stripping. The orientations of dust lanes along with the presence of cometary tails in radio continuum observations are strong evidence supporting RPS in this galaxy. We have identified the candidate star-forming knots that appear to be connected to the main body of the galaxy by low surface brightness features, with the direction of the features indicating that these are likely due to ongoing star formation in the ram-pressure stripped tails of the galaxy. This is further corroborated using the NUV N245M imaging data of the galaxies. We identified those knots that fall within the NUV N245M contours as star-forming knots in the stripped tails of the galaxies. We caution here that there can be background or foreground objects contaminating the knots, and in the absence of a redshift estimation, we cannot quantify them as real knots associated with the RPS. The presence of associated diffuse emission, oriented towards the knots as shown in Figs. 6 and 8, suggests that these are formed in situ in the stripped tails of the galaxies. The positions of detected knots from the stripped tails of UGC 2665 and MCG +07-07-070 in the u − r, g − i colour-colour plane are consistent with hosting recent star formation.
The current study showcases Euclid’s ability to resolve faint star-forming knots in optical and near-infrared at the smallest possible scales across a wide region around galaxies undergoing RPS in the Perseus cluster. The imaging data, with its excellent image quality (FWHM ≈  ) and high sensitivity to low surface brightness features (μ ∼ 30.1 mag arcsec−2), enables us to detect the furthest extent of star-forming regions associated with stripping at different distances from the galaxy’s disc at the highest spatial resolution. The extent of star formation in the stripped tails can be identified by measuring the length of the low surface brightness diffuse features. The longer the length, the more extended the regions of ongoing star formation, and hence the larger the strength of RPS. The detected diffuse features are expected to be longer for galaxies in clusters that experience higher ram pressure effects Kenney et al. 2004.
The Euclid ERO of the Perseus cluster field is taken with 4 ROS, whereas the normal EWS will have only a single ROS. The ERO data are therefore slightly deeper than the normal EWS, for which the expected limiting surface brightness for diffuse emission is 29.8 mag arcsec−2 in IEEuclid Collaboration: Scaramella et al. 2022. The EWS will provide uniform optical and near-infrared imaging data for a 14 000 deg2 area of the sky, offering a spatial resolution and low surface brightness that enables the detection of low surface brightness features associated with perturbed galaxies within different regions of galaxy clusters, galaxy groups, and even in the field environment. This will enable studies of star formation quenching mechanisms at different redshifts and will enable identification of which processes were dominant when the Universe was much younger and denser. The dominant perturbation mechanism leading to star formation quenching can be identified using low surface brightness imaging data over a wide field of view around the galaxies. This information enables us to quantify the fraction of RPS tails in galaxies, where star formation occurs, and allows for comparisons with other multi-wavelength data, tuned models, and hydrodynamic simulations. The occurrence of star formation in the stripped tails is intriguing, particularly since it happens in the very hostile environment of hot, dense ICM. There are observations of galaxies with stripped tails of cold, ionised, or hot gas, but with little or no associated star formation (eg: Vollmer et al. 2012; George et al. 2025, also see Table 2 of Boselli et al. 2022 for a list of RPS galaxies in local Universe cluster). The reason for this low star formation efficiency along the stripped tails of some galaxies is not understood. Studies of the stripped tails, both with and without star formation, can provide important clues about the required conditions for the progression of star formation in these environments. It is essential to detect the extent and understand the nature of star formation in the stripped tails of these galaxies. Understanding in situ star formation at pc scales in the stripped tails of galaxies is crucial to determine the scales at which gas collapses in the hostile environment of hot and dense ICM. By combining this with cold gas (H I & H2) measurements, we can gain insight into the efficiency of star formation in these environments. Euclid’s low surface brightness optimized imaging can identify galaxies with faint signatures of RPS near the disc, characterized by little or no star formation, as well as those with significant star formation along the tails. Using sensitive radio telescopes such as MeerKAT to obtain H I data, we can compare the H I tail with the Euclid imaging data to measure the extent of stellar emission along the stripped tails of these galaxies. Analysing a large statistical sample of RPS galaxies across various environments and redshifts allows us to gain insights into the evolution of star formation and general trends in star formation efficiency within stripped tails, which can be compared to models Taylor & Webster 2005; Burkhart & Loeb 2016 and simulations Kronberger et al. 2008; Tonnesen & Bryan 2012; Steyrleithner et al. 2020; Boselli et al. 2021.
5. Summary
Using high-resolution optical and near-infrared imaging observations optimized for low surface brightness, we demonstrate how Euclid can uniquely study galaxy evolution in dense environments, as exemplified by two galaxies in the Perseus cluster. These galaxies display filamentary structures suggesting an external perturbation. Euclid ERO of the Perseus cluster, combined with multi-wavelength data including the NUV, Hα, and radio continuum imaging, we demonstrate that the dominant perturbing mechanism for these galaxies is RPS. Euclid’s low surface brightness optimised imaging capability has made it possible to detect the diffuse features visible in optical and near-infrared along the stripped tails of these galaxies. We have detected features associated with the stripped tails of the galaxies, with 252 detected for UGC 2665 and 433 detected for MCG +07-07-070 from IE imaging, which are associated with the diffuse emission. The detected features have a limiting surface brightness of 25.17 mag arcsec−2, covering an area of 0.20 arcsec2 for UGC 2665, and 25.17 mag arcsec−2, covering an area of 0.48 arcsec2 for MCG +07-07-070. The detected features show good correspondence in morphology between optical and infrared (YE, JE, HE) at the smallest spatial scales possible with Euclid imaging. Euclid colours alone are insufficient for studying stellar population ages in unresolved star-forming regions. We constructed the Euclid IE−YE, YE−HE, and CFHT u − r, g − i colour-colour plane and used single stellar population models to demonstrate that the position of these detected features can be explained by recent star formation. Some features on the higher age model grid may be due to the presence of dust stripped along with gas in these regions. We detect 42 knots for UGC 2665 and 46 knots for MCG +07-07-070 at the resolution limit of the IE imaging data. These unresolved knots have a size of ≤108 pc with limiting magnitudes of 27.8 mag for UGC 2665 and 30.2 mag for MCG +07-07-070.
The study of two galaxies undergoing RPS, with ∼30.1 mag arcsec−2 surface brightness features at scales of ∼108 pc, showcases Euclid’s potential to detect and characterize galaxies undergoing morphological transformation in dense environments. The wide and deep survey by Euclid will provide a unique dataset of optical and infrared imaging, covering a large region and enabling the detection of features around a statistically significant number of galaxies of varying masses at different environments, a feat previously impossible.
The term σ is the sky RMS.
Acknowledgments
This work has made use of the Early Release Observations (ERO) data from the Euclid mission of the European Space Agency (ESA), 2024, https://doi.org/10.57780/esa-qmocze3. The Euclid Consortium acknowledges the European Space Agency and a number of agencies and institutes that have supported the development of Euclid, in particular the Agenzia Spaziale Italiana, the Austrian Forschungsförderungsgesellschaft funded through BMK, the Belgian Science Policy, the Canadian Euclid Consortium, the Deutsches Zentrum für Luft- und Raumfahrt, the DTU Space and the Niels Bohr Institute in Denmark, the French Centre National d’Etudes Spatiales, the Fundação para a Ciência e a Tecnologia, the Hungarian Academy of Sciences, the Ministerio de Ciencia, Innovación y Universidades, the National Aeronautics and Space Administration, the National Astronomical Observatory of Japan, the Netherlandse Onderzoekschool Voor Astronomie, the Norwegian Space Agency, the Research Council of Finland, the Romanian Space Agency, the State Secretariat for Education, Research, and Innovation (SERI) at the Swiss Space Office (SSO), and the United Kingdom Space Agency. A complete and detailed list is available on the Euclid web site (http://www.euclid-ec.org). E.S is grateful to the Leverhulme Trust for funding under the grant number RPG-2021-205. Based on observations obtained with MegaPrime/MegaCam, a joint project of CFHT and CEA/DAPNIA, at the Canada-France-Hawaii Telescope (CFHT) which is operated by the National Research Council (NRC) of Canada, the Institut National des Science de l’Univers of the Centre National de la Recherche Scientifique (CNRS) of France, and the University of Hawaii. The observations at the Canada-France-Hawaii Telescope were performed with care and respect from the summit of Maunakea which is a significant cultural and historic site. This work presents results from the European Space Agency (ESA) space mission Gaia. Gaia data are being processed by the Gaia Data Processing and Analysis Consortium (DPAC). Funding for the DPAC is provided by national institutions, in particular the institutions participating in the Gaia MultiLateral Agreement (MLA).
References
- Abramson, A., & Kenney, J. D. P. 2014, AJ, 147, 63 [Google Scholar]
- Abramson, A., Kenney, J., Crowl, H., & Tal, T. 2016, AJ, 152, 32 [Google Scholar]
- Agrawal, P. C. 2006, Adv. Space Res., 38, 2989 [Google Scholar]
- Aguerri, J. A. L., Girardi, M., Agulli, I., et al. 2020, MNRAS, 494, 1681 [NASA ADS] [CrossRef] [Google Scholar]
- Barnes, J. E. 2004, MNRAS, 350, 798 [NASA ADS] [CrossRef] [Google Scholar]
- Barnes, J. E., & Hernquist, L. 1992, ARA&A, 30, 705 [Google Scholar]
- Behroozi, P. S., Wechsler, R. H., & Conroy, C. 2013, ApJ, 770, 57 [NASA ADS] [CrossRef] [Google Scholar]
- Bellhouse, C., Jaffé, Y. L., Hau, G. K. T., et al. 2017, ApJ, 844, 49 [NASA ADS] [CrossRef] [Google Scholar]
- Bellhouse, C., McGee, S. L., Smith, R., et al. 2021, MNRAS, 500, 1285 [Google Scholar]
- Bertin, E., & Arnouts, S. 1996, A&AS, 117, 393 [NASA ADS] [CrossRef] [EDP Sciences] [Google Scholar]
- Bertin, E., Schefer, M., Apostolakos, N., et al. 2020, ASP Conf. Ser., 527, 461 [NASA ADS] [Google Scholar]
- Bílek, M., Duc, P.-A., Cuillandre, J.-C., et al. 2020, MNRAS, 498, 2138 [Google Scholar]
- Bílek, M., Fensch, J., Ebrová, I., et al. 2022, A&A, 660, A28 [NASA ADS] [CrossRef] [EDP Sciences] [Google Scholar]
- Binney, J., & Tremaine, S. 2008, Galactic Dynamics: Second Edition, Revised, 2nd edn. (Princeton University Press) [Google Scholar]
- Boissier, S., Boselli, A., Duc, P. A., et al. 2012, A&A, 545, A142 [NASA ADS] [CrossRef] [EDP Sciences] [Google Scholar]
- Bolzonella, M., Miralles, J. M., & Pelló, R. 2000, A&A, 363, 476 [NASA ADS] [Google Scholar]
- Bolzonella, M., Kovač, K., Pozzetti, L., et al. 2010, A&A, 524, A76 [NASA ADS] [CrossRef] [EDP Sciences] [Google Scholar]
- Boselli, A., & Gavazzi, G. 2006, PASP, 118, 517 [Google Scholar]
- Boselli, A., & Gavazzi, G. 2014, A&ARv, 22, 74 [Google Scholar]
- Boselli, A., Lequeux, J., & Gavazzi, G. 2002, A&A, 384, 33 [NASA ADS] [CrossRef] [EDP Sciences] [Google Scholar]
- Boselli, A., Boissier, S., Cortese, L., et al. 2009, ApJ, 706, 1527 [Google Scholar]
- Boselli, A., Cuillandre, J. C., Fossati, M., et al. 2016, A&A, 587, A68 [NASA ADS] [CrossRef] [EDP Sciences] [Google Scholar]
- Boselli, A., Fossati, M., Cuillandre, J. C., et al. 2018, A&A, 615, A114 [NASA ADS] [CrossRef] [EDP Sciences] [Google Scholar]
- Boselli, A., Lupi, A., Epinat, B., et al. 2021, A&A, 646, A139 [NASA ADS] [CrossRef] [EDP Sciences] [Google Scholar]
- Boselli, A., Fossati, M., & Sun, M. 2022, A&ARv, 30, 3 [NASA ADS] [CrossRef] [Google Scholar]
- Boselli, A., Serra, P., de Gasperin, F., et al. 2023, A&A, 676, A92 [NASA ADS] [CrossRef] [EDP Sciences] [Google Scholar]
- Brinchmann, J., Charlot, S., White, S. D. M., et al. 2004, MNRAS, 351, 1151 [Google Scholar]
- Bruzual, G., & Charlot, S. 2003, MNRAS, 344, 1000 [NASA ADS] [CrossRef] [Google Scholar]
- Burkhart, B., & Loeb, A. 2016, ApJ, 824, L7 [Google Scholar]
- Cardelli, J. A., Clayton, G. C., & Mathis, J. S. 1989, ApJ, 345, 245 [Google Scholar]
- Chung, A., van Gorkom, J. H., Kenney, J. D. P., Crowl, H., & Vollmer, B. 2009, AJ, 138, 1741 [Google Scholar]
- Churazov, E., Forman, W., Jones, C., & Böhringer, H. 2003, ApJ, 590, 225 [NASA ADS] [CrossRef] [Google Scholar]
- Cid Fernandes, R., Stasińska, G., Mateus, A., & Vale Asari, N. 2011, MNRAS, 413, 1687 [Google Scholar]
- Cortese, L., Marcillac, D., Richard, J., et al. 2007, MNRAS, 376, 157 [Google Scholar]
- Cortese, L., Boissier, S., Boselli, A., et al. 2012, A&A, 544, A101 [NASA ADS] [CrossRef] [EDP Sciences] [Google Scholar]
- Cortese, L., Catinella, B., & Smith, R. 2021, PASA, 38, e035 [NASA ADS] [CrossRef] [Google Scholar]
- Cowie, L. L., & Songaila, A. 1977, Nature, 266, 501 [Google Scholar]
- Cramer, W. J., Kenney, J. D. P., Sun, M., et al. 2019, ApJ, 870, 63 [Google Scholar]
- Cropper, M., Pottinger, S., Niemi, S. M., et al. 2014, SPIE Conf. Ser., 9143, 91430J [NASA ADS] [Google Scholar]
- Cropper, M., Pottinger, S., Niemi, S., et al. 2016, SPIE Conf. Ser., 9904, 99040Q [NASA ADS] [Google Scholar]
- Cuillandre, J. C., Bolzonella, M., Boselli, A., et al. 2025a, A&A, 697, A11 [Google Scholar]
- Cuillandre, J. C., Bertin, E., Bolzonella, M., et al. 2025b, A&A, 697, A6 [Google Scholar]
- Daddi, E., Dickinson, M., Morrison, G., et al. 2007, ApJ, 670, 156 [NASA ADS] [CrossRef] [Google Scholar]
- Dressler, A. 2004, in Clusters of Galaxies: Probes of Cosmological Structure and Galaxy Evolution, eds. J. S. Mulchaey, A. Dressler, & A. Oemler, 206 [Google Scholar]
- Duc, P.-A., Cuillandre, J.-C., Karabal, E., et al. 2015, MNRAS, 446, 120 [Google Scholar]
- Durret, F., Chiche, S., Lobo, C., & Jauzac, M. 2021, A&A, 648, A63 [NASA ADS] [CrossRef] [EDP Sciences] [Google Scholar]
- Ebeling, H., Stephenson, L. N., & Edge, A. C. 2014, ApJ, 781, L40 [Google Scholar]
- Elbaz, D., Daddi, E., Le Borgne, D., et al. 2007, A&A, 468, 33 [NASA ADS] [CrossRef] [EDP Sciences] [Google Scholar]
- Elmegreen, B. G. 2010, IAU Symp., 266, 3 [Google Scholar]
- Elmegreen, D. M., Elmegreen, B. G., Adamo, A., et al. 2014, ApJ, 787, L15 [NASA ADS] [CrossRef] [Google Scholar]
- Euclid Collaboration (Scaramella, R., et al.) 2022, A&A, 662, A112 [NASA ADS] [CrossRef] [EDP Sciences] [Google Scholar]
- Euclid Collaboration (Cropper, M. S., et al.) 2025, A&A, 697, A2 [Google Scholar]
- Euclid Collaboration (Jahnke, K., et al.) 2025, A&A, 697, A3 [Google Scholar]
- Euclid Collaboration (Mellier, Y., et al.) 2025, A&A, 697, A1 [Google Scholar]
- Euclid Early Release Observations 2025, https://doi.org/10.57780/esa-qmocze3 [Google Scholar]
- Fossati, M., Gavazzi, G., Savorgnan, G., et al. 2013, A&A, 553, A91 [NASA ADS] [CrossRef] [EDP Sciences] [Google Scholar]
- Fritz, J., Moretti, A., Gullieuszik, M., et al. 2017, ApJ, 848, 132 [NASA ADS] [CrossRef] [Google Scholar]
- Fumagalli, M., Fossati, M., Hau, G. K. T., et al. 2014, MNRAS, 445, 4335 [Google Scholar]
- Gannon, J. S., Forbes, D. A., Romanowsky, A. J., et al. 2022, MNRAS, 510, 946 [Google Scholar]
- Gavazzi, G., Boselli, A., Mayer, L., et al. 2001, ApJ, 563, L23 [Google Scholar]
- George, K., Poggianti, B. M., Gullieuszik, M., et al. 2018, MNRAS, 479, 4126 [Google Scholar]
- George, K., Poggianti, B. M., Tomičić, N., et al. 2023, MNRAS, 519, 2426 [Google Scholar]
- George, K., Poggianti, B. M., Omizzolo, A., et al. 2024, A&A, 690, A337 [NASA ADS] [CrossRef] [EDP Sciences] [Google Scholar]
- George, K., Poggianti, B. M., Vulcani, B., et al. 2025, A&A, 700, A38 [NASA ADS] [CrossRef] [EDP Sciences] [Google Scholar]
- Giunchi, E., Gullieuszik, M., Poggianti, B. M., et al. 2023a, ApJ, 949, 72 [NASA ADS] [CrossRef] [Google Scholar]
- Giunchi, E., Poggianti, B. M., Gullieuszik, M., et al. 2023b, ApJ, 958, 73 [NASA ADS] [CrossRef] [Google Scholar]
- Giunchi, E., Scarlata, C., Werle, A., et al. 2025, A&A, 696, A228 [NASA ADS] [CrossRef] [EDP Sciences] [Google Scholar]
- Gullieuszik, M., Poggianti, B. M., Moretti, A., et al. 2017, ApJ, 846, 27 [Google Scholar]
- Gullieuszik, M., Poggianti, B. M., McGee, S. L., et al. 2020, ApJ, 899, 13 [Google Scholar]
- Gullieuszik, M., Giunchi, E., Poggianti, B. M., et al. 2023, ApJ, 945, 54 [NASA ADS] [CrossRef] [Google Scholar]
- Gunn, J. E., & Gott, J. R. I. I. I. 1972, ApJ, 176, 1 [NASA ADS] [CrossRef] [Google Scholar]
- Hardcastle, M. J., & Croston, J. H. 2020, New Astron. Rev., 88, 101539 [Google Scholar]
- Henriksen, M., & Byrd, G. 1996, ApJ, 459, 82 [NASA ADS] [CrossRef] [Google Scholar]
- Hester, J. A., Seibert, M., Neill, J. D., et al. 2010, ApJ, 716, L14 [Google Scholar]
- Hunt, L. K., & Hirashita, H. 2009, A&A, 507, 1327 [NASA ADS] [CrossRef] [EDP Sciences] [Google Scholar]
- Ignesti, A., Vulcani, B., Poggianti, B. M., et al. 2022, ApJ, 924, 64 [NASA ADS] [CrossRef] [Google Scholar]
- Jáchym, P., Combes, F., Cortese, L., Sun, M., & Kenney, J. D. P. 2014, ApJ, 792, 11 [Google Scholar]
- Jáchym, P., Sun, M., Kenney, J. D. P., et al. 2017, ApJ, 839, 114 [Google Scholar]
- Jáchym, P., Kenney, J. D. P., Sun, M., et al. 2019, ApJ, 883, 145 [Google Scholar]
- Joseph, P., Tandon, S. N., Ghosh, S. K., & Stalin, C. S. 2025, ArXiv e-prints [arXiv:2504.00982] [Google Scholar]
- Kang, W., Hwang, H. S., Song, H., et al. 2024, ApJS, 272, 22 [Google Scholar]
- Kenney, J. D. P., & Koopmann, R. A. 1999, AJ, 117, 181 [NASA ADS] [CrossRef] [Google Scholar]
- Kenney, J. D. P., van Gorkom, J. H., & Vollmer, B. 2004, AJ, 127, 3361 [Google Scholar]
- Kenney, J. D. P., Geha, M., Jáchym, P., et al. 2014, ApJ, 780, 119 [Google Scholar]
- Kenney, J. D. P., Abramson, A., & Bravo-Alfaro, H. 2015, AJ, 150, 59 [Google Scholar]
- Kennicutt, R. C., Jr 1998, ARA&A, 36, 189 [NASA ADS] [CrossRef] [Google Scholar]
- Kennicutt, R. C., & Evans, N. J. 2012, ARA&A, 50, 531 [NASA ADS] [CrossRef] [Google Scholar]
- Kent, S. M., & Sargent, W. L. W. 1983, AJ, 88, 697 [NASA ADS] [CrossRef] [Google Scholar]
- Koopmann, R. A., & Kenney, J. D. P. 2004a, ApJ, 613, 851 [NASA ADS] [CrossRef] [Google Scholar]
- Koopmann, R. A., & Kenney, J. D. P. 2004b, ApJ, 613, 866 [Google Scholar]
- Koopmann, R. A., Haynes, M. P., & Catinella, B. 2006, AJ, 131, 716 [NASA ADS] [CrossRef] [Google Scholar]
- Kronberger, T., Kapferer, W., Unterguggenberger, S., Schindler, S., & Ziegler, B. L. 2008, A&A, 483, 783 [NASA ADS] [CrossRef] [EDP Sciences] [Google Scholar]
- Kroupa, P. 2001, MNRAS, 322, 231 [NASA ADS] [CrossRef] [Google Scholar]
- Kümmel, M., Álvarez-Ayllón, A., Bertin, E., et al. 2022, ArXiv e-prints [arXiv:2212.02428] [Google Scholar]
- Larson, R. B., Tinsley, B. M., & Caldwell, C. N. 1980, ApJ, 237, 692 [Google Scholar]
- Laudari, S., Jáchym, P., Sun, M., et al. 2022, MNRAS, 509, 3938 [Google Scholar]
- Longobardi, A., Boselli, A., Fossati, M., et al. 2020, A&A, 644, A161 [EDP Sciences] [Google Scholar]
- Maciaszek, T., Ealet, A., Jahnke, K., et al. 2014, SPIE Conf. Ser., 9143, 91430K [NASA ADS] [Google Scholar]
- Maciaszek, T., Ealet, A., Jahnke, K., et al. 2016, SPIE Conf. Ser., 9904, 99040T [NASA ADS] [Google Scholar]
- Mancillas, B., Duc, P.-A., Combes, F., et al. 2019, A&A, 632, A122 [NASA ADS] [CrossRef] [EDP Sciences] [Google Scholar]
- Mastropietro, C., Moore, B., Mayer, L., et al. 2005, MNRAS, 364, 607 [Google Scholar]
- Merluzzi, P., Busarello, G., Dopita, M. A., et al. 2013, MNRAS, 429, 1747 [Google Scholar]
- Meusinger, H., Rudolf, C., Stecklum, B., et al. 2020, A&A, 640, A30 [NASA ADS] [CrossRef] [EDP Sciences] [Google Scholar]
- Mondelin, M., Bournaud, F., Cuillandre, J. C., et al. 2025, A&A, 699, A214 [NASA ADS] [CrossRef] [EDP Sciences] [Google Scholar]
- Moore, B., Katz, N., Lake, G., Dressler, A., & Oemler, A. 1996, Nature, 379, 613 [Google Scholar]
- Moretti, A., Paladino, R., Poggianti, B. M., et al. 2018, MNRAS, 480, 2508 [Google Scholar]
- Navarro, J. F., Frenk, C. S., & White, S. D. M. 1997, ApJ, 490, 493 [Google Scholar]
- Noeske, K. G., Weiner, B. J., Faber, S. M., et al. 2007, ApJ, 660, L43 [CrossRef] [Google Scholar]
- Owen, F. N., Keel, W. C., Wang, Q. D., Ledlow, M. J., & Morrison, G. E. 2006, AJ, 131, 1974 [Google Scholar]
- Owers, M. S., Couch, W. J., Nulsen, P. E. J., & Randall, S. W. 2012, ApJ, 750, L23 [Google Scholar]
- Planck Collaboration VI. 2020, A&A, 641, A6 [NASA ADS] [CrossRef] [EDP Sciences] [Google Scholar]
- Poggianti, B. M., Fasano, G., Omizzolo, A., et al. 2016, AJ, 151, 78 [Google Scholar]
- Poggianti, B. M., Gullieuszik, M., Tonnesen, S., et al. 2019, MNRAS, 482, 4466 [Google Scholar]
- Poggianti, B. M., Vulcani, B., Tomicic, N., et al. 2025, A&A, 699, A357 [NASA ADS] [CrossRef] [EDP Sciences] [Google Scholar]
- Popesso, P., Concas, A., Cresci, G., et al. 2023, MNRAS, 519, 1526 [Google Scholar]
- Portegies Zwart, S. F., McMillan, S. L. W., & Gieles, M. 2010, ARA&A, 48, 431 [NASA ADS] [CrossRef] [Google Scholar]
- Rawle, T. D., Altieri, B., Egami, E., et al. 2014, MNRAS, 442, 196 [Google Scholar]
- Roberts, I. D., van Weeren, R. J., McGee, S. L., et al. 2021a, A&A, 650, A111 [NASA ADS] [CrossRef] [EDP Sciences] [Google Scholar]
- Roberts, I. D., van Weeren, R. J., McGee, S. L., et al. 2021b, A&A, 652, A153 [NASA ADS] [CrossRef] [EDP Sciences] [Google Scholar]
- Roberts, I. D., van Weeren, R. J., Timmerman, R., et al. 2022, A&A, 658, A44 [NASA ADS] [CrossRef] [EDP Sciences] [Google Scholar]
- Roediger, E., Bruggen, M., Owers, M. S., Ebeling, H., & Sun, M. 2014, MNRAS, 443, L114 [NASA ADS] [CrossRef] [Google Scholar]
- Salim, S., Rich, R. M., Charlot, S., et al. 2007, ApJS, 173, 267 [NASA ADS] [CrossRef] [Google Scholar]
- Salinas, V., Jaffé, Y. L., Smith, R., et al. 2024, MNRAS, 533, 341 [NASA ADS] [CrossRef] [Google Scholar]
- Sarazin, C. L. 1986, Rev. Mod. Phys., 58, 1 [Google Scholar]
- Schulz, S., & Struck, C. 2001, MNRAS, 328, 185 [NASA ADS] [CrossRef] [Google Scholar]
- Serra, P., Maccagni, F. M., Kleiner, D., et al. 2023, A&A, 673, A146 [NASA ADS] [CrossRef] [EDP Sciences] [Google Scholar]
- Shimwell, T. W., Röttgering, H. J. A., Best, P. N., et al. 2017, A&A, 598, A104 [NASA ADS] [CrossRef] [EDP Sciences] [Google Scholar]
- Shimwell, T. W., Tasse, C., Hardcastle, M. J., et al. 2019, A&A, 622, A1 [NASA ADS] [CrossRef] [EDP Sciences] [Google Scholar]
- Smith, R. J., Lucey, J. R., Hammer, D., et al. 2010, MNRAS, 408, 1417 [Google Scholar]
- Smith, R., Shinn, J.-H., Tonnesen, S., et al. 2022, ApJ, 934, 86 [NASA ADS] [CrossRef] [Google Scholar]
- Sola, E., Duc, P.-A., Richards, F., et al. 2022, A&A, 662, A124 [NASA ADS] [CrossRef] [EDP Sciences] [Google Scholar]
- Steinhauser, D., Schindler, S., & Springel, V. 2016, A&A, 591, A51 [NASA ADS] [CrossRef] [EDP Sciences] [Google Scholar]
- Steyrleithner, P., Hensler, G., & Boselli, A. 2020, MNRAS, 494, 1114 [Google Scholar]
- Sun, M., Jones, C., Forman, W., et al. 2006, ApJ, 637, L81 [Google Scholar]
- Tandon, S. N., Subramaniam, A., Girish, V., et al. 2017, AJ, 154, 128 [NASA ADS] [CrossRef] [Google Scholar]
- Tandon, S. N., Postma, J., Joseph, P., et al. 2020, AJ, 159, 158 [Google Scholar]
- Taylor, E. N., & Webster, R. L. 2005, ApJ, 634, 1067 [Google Scholar]
- Tonnesen, S., & Bryan, G. L. 2012, MNRAS, 422, 1609 [CrossRef] [Google Scholar]
- Valluri, M. 1993, ApJ, 408, 57 [NASA ADS] [CrossRef] [Google Scholar]
- van Weeren, R. J., de Gasperin, F., Akamatsu, H., et al. 2019, Space Sci. Rev., 215, 16 [Google Scholar]
- van Weeren, R. J., Timmerman, R., Vaidya, V., et al. 2024, A&A, 692, A12 [NASA ADS] [CrossRef] [EDP Sciences] [Google Scholar]
- Vollmer, B., Beck, R., Kenney, J. D. P., & van Gorkom, J. H. 2004, AJ, 127, 3375 [NASA ADS] [CrossRef] [Google Scholar]
- Vollmer, B., Wong, O. I., Braine, J., Chung, A., & Kenney, J. D. P. 2012, A&A, 543, A33 [NASA ADS] [CrossRef] [EDP Sciences] [Google Scholar]
- Vulcani, B., Fritz, J., Poggianti, B. M., et al. 2020, ApJ, 892, 146 [Google Scholar]
- Vulcani, B., Poggianti, B. M., Smith, R., et al. 2022, ApJ, 927, 91 [NASA ADS] [CrossRef] [Google Scholar]
- Waldron, W., Sun, M., Luo, R., et al. 2023, MNRAS, 522, 173 [NASA ADS] [CrossRef] [Google Scholar]
- Yagi, M., Komiyama, Y., Yoshida, M., et al. 2007, ApJ, 660, 1209 [Google Scholar]
- Yagi, M., Yoshida, M., Komiyama, Y., et al. 2010, AJ, 140, 1814 [Google Scholar]
- Yagi, M., Yoshida, M., Gavazzi, G., et al. 2017, ApJ, 839, 65 [NASA ADS] [CrossRef] [Google Scholar]
- Yoshida, M., Yagi, M., Komiyama, Y., et al. 2008, ApJ, 688, 918 [Google Scholar]
- Yoshida, M., Yagi, M., Komiyama, Y., et al. 2012, ApJ, 749, 43 [NASA ADS] [CrossRef] [Google Scholar]
Appendix A: Fireball features for galaxy MCG +07-07-070
Euclid’s low surface brightness optimised imaging capability has made it possible to detect the diffuse features visible in optical and near-infrared along the stripped tails of MCG +07-07-070 galaxy. The bright knots and the diffuse feature seen in Fig. 8 for galaxy MCG +07-07-070 are thought to have formed due to the “fireball” scenario described by Kenney et al. 2014 and summarised as follows: A gas-rich spiral galaxy falls for the first time at high velocity into a galaxy cluster and can undergo strong RPS. The stripped gas clouds can be moving in the opposite direction of the motion of the galaxy. As the gas cloud accelerates and moves with the galaxy, new stars are forming within it, while slightly older stars become decoupled. This is possible since stars are not affected by RPS and new stars, once formed, are bound only to the gravitational potential of the galaxy. This scenario results in a knot-like region associated with the gas cloud, where the most recent star formation is taking place. A trail follows, where a slightly older population, which formed within the gas cloud, is present. The diffuse trail region should therefore contain a slightly more evolved population of stars compared to the head region (see Kenney et al. 2014 for a cartoon of the fireball model, Fig. 16.)
Appendix B: Segmentation map of detected features
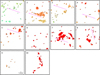 |
Fig. B.1. Zoom-in on the segmentation map of region selected from IE imaging of stripped features for UGC 2665. Each box has a size of 5.1 kpc × 4.4 kpc with the arcsec bar shown corresponding to 338 pc at cluster frame. The details of markers are the same as in Fig. 3. Segments are marked with individual identification number with colour scale to red shows the progressing identification number. |
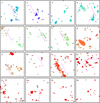 |
Fig. B.2. Zoom-in on the segmentation map of region selected from IE imaging of stripped features for MCG +07-07-070. The details of markers are the same as in Fig. 4 and other details are same as in Fig. B.1. |
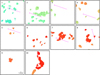 |
Fig. B.3. Zoom-in on the segmentation map of region selected from YE imaging of stripped features for UGC 2665. The details of markers are the same as in Fig. 3 and other details are same as in Fig. B.1. |
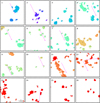 |
Fig. B.4. Zoom-in on the segmentation map of region selected from YE imaging of stripped features for MCG +07-07-070. The details of markers are the same as in Fig. 4 and other details are same as in Fig. B.1. |
All Tables
Parameters used for SourceXtractor++ run of u, IE, YE, JE, HE images of the two galaxies.
Number of the features detected independently from IE, YE, JE, HE images of the two galaxies.
Surface brightness and the corresponding area of the faintest features detected from IE,YE,JE,HE images of the two galaxies.
All Figures
|
Fig. 1. Colour-composite image of the UGC 2665 galaxy created by combining and assigning blue, green, and red colours for IE, YE, and HE imaging data. The direction to the cluster centre is shown with a light magenta-coloured arrow. In the bottom right of the image, the blue patch is an artefact caused by dichroic ghost in IE imaging. |
| In the text | |
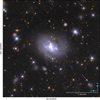 |
Fig. 2. Colour composite image of the MCG +07-07-070 galaxy. Details are same as in Fig. 1. |
| In the text | |
|
Fig. 3. Colour scale IE image of galaxy UGC 2665 with the scaling set to highlight faint stripped features at the galaxy outskirts. The features that are likely part of the stripped tail are marked with cyan boxes. Coloured contours overlaid on the image are for NUV N245M imaging data of the galaxy in blue, Hα in red and 144 MHz radio continuum in black. The NUV and Hα contour levels created for 2σ, 4σ and 6σ are shown. The contour levels created for 3σ, 6σ and 12σ from LOFAR image are shown. The direction of the stripping feature is marked with magenta-coloured arrows. White contours show isophote generated for surface brightness level of 30 mag arcsec−2. |
| In the text | |
|
Fig. 4. Colour scale IE image of galaxy MCG +07-07-070 with the scaling set to highlight faint stripped features at the galaxy outskirts. Details are same as in Fig. 3. |
| In the text | |
|
Fig. 5. Left panel: IE image of UGC 2665 galaxy “unwrapped” in polar coordinates in terms of radial distance from the centre of the galaxy (r) and azimuthal angle around the disc (θ). Right panel: Original image in greyscale. Logarithmic spiral arms have been drawn on the left-hand panel on the prominent dust lanes in cyan colour crosses. Spiral arms are shown projected back onto the galaxy disc on the right panel. |
| In the text | |
|
Fig. 6. Zoom-in on the IE imaging of stripped features for UGC 2665 galaxy. These correspond to the boxes marked in Fig. 3. Each box has a size of 5.1 kpc × 4.4 kpc with the arcsec bar shown corresponding to 338 pc at cluster frame. The details of markers are as in Fig. 3. Contours corresponding to the boundaries of the segments detected from IE image in section 3.3 are overlaid. |
| In the text | |
|
Fig. 7. Zoom-in on the YE band imaging of stripped features for UGC 2665 galaxy. These correspond to the boxes marked in Fig. 3. Each box has a size of 5.1 kpc × 4.4 kpc with the arcsec bar shown corresponding to 338 pc at cluster frame. The details of markers are the same as in Fig. 3. Contours corresponding to the boundaries of the segments detected from YE image in Section 3.3 are overlaid. |
| In the text | |
|
Fig. 8. Zoom-in on the IE imaging of stripped features for MCG +07-07-070. These correspond to the boxes marked in Fig. 4. Each box is having a size of 5.1 kpc × 4.4 kpc with the arcsec bar shown corresponding to 338 pc at cluster frame. The details of markers are the same as in Fig. 4. Contours corresponding to the boundaries of the segments detected from IE image in Section 3.3 are overlaid. |
| In the text | |
|
Fig. 9. Zoom-in on the YE band imaging of stripped features for MCG +07-07-070. These correspond to the boxes marked in Fig. 4. Each box has a size of 5.1 kpc × 4.4 kpc with the arcsec bar shown corresponding to 338 pc at cluster frame. The details of markers are the same as in Fig. 4. Contours corresponding to the boundaries of the segments detected from YE image in Section 3.3 are overlaid. |
| In the text | |
|
Fig. 10. Distribution of surface brightness of segments from the stripped tails detected from IE, YE, JE, HE images of UGC 2665 and MCG+07−07−070. Poisson errors are shown with an error bar. |
| In the text | |
|
Fig. 11. Colour-colour plot of the detected knots created using IE−YE, YE−HE colour combination for UGC 2665 and MCG +07-07-070. We show the colour of the low surface brightness features detected from the segmentation map over the stripped tails of the galaxies. The colour values for different single stellar population ages generated using BC03 stellar population models, Padova 94 isochrones, and Kroupa IMF for solar metallicity are shown in filled circles connected with dotted line. The corresponding age is shown in the colour-bar scale. The IE−YE and YE−HE colour distribution of the knots are shown in side panels. |
| In the text | |
|
Fig. 12. Colour-colour plot of the detected knots created using YE−JE, YE−HE colour combination for UGC 2665 and MCG +07-07-070. Details are same as in Fig. 11. |
| In the text | |
|
Fig. 13. Colour-colour plot of the detected knots created using u − r, g − i colour combination for UGC 2665 and MCG +07-07-070. Details are same as in Fig. 11. |
| In the text | |
|
Fig. 14. Distribution of the magnitudes of smallest knots detected from IE image of UGC 2665 and MCG+07−07−070. Poisson errors are shown with an error bar. |
| In the text | |
|
Fig. B.1. Zoom-in on the segmentation map of region selected from IE imaging of stripped features for UGC 2665. Each box has a size of 5.1 kpc × 4.4 kpc with the arcsec bar shown corresponding to 338 pc at cluster frame. The details of markers are the same as in Fig. 3. Segments are marked with individual identification number with colour scale to red shows the progressing identification number. |
| In the text | |
|
Fig. B.2. Zoom-in on the segmentation map of region selected from IE imaging of stripped features for MCG +07-07-070. The details of markers are the same as in Fig. 4 and other details are same as in Fig. B.1. |
| In the text | |
|
Fig. B.3. Zoom-in on the segmentation map of region selected from YE imaging of stripped features for UGC 2665. The details of markers are the same as in Fig. 3 and other details are same as in Fig. B.1. |
| In the text | |
|
Fig. B.4. Zoom-in on the segmentation map of region selected from YE imaging of stripped features for MCG +07-07-070. The details of markers are the same as in Fig. 4 and other details are same as in Fig. B.1. |
| In the text | |
Current usage metrics show cumulative count of Article Views (full-text article views including HTML views, PDF and ePub downloads, according to the available data) and Abstracts Views on Vision4Press platform.
Data correspond to usage on the plateform after 2015. The current usage metrics is available 48-96 hours after online publication and is updated daily on week days.
Initial download of the metrics may take a while.