Fig. B.1.
Download original image
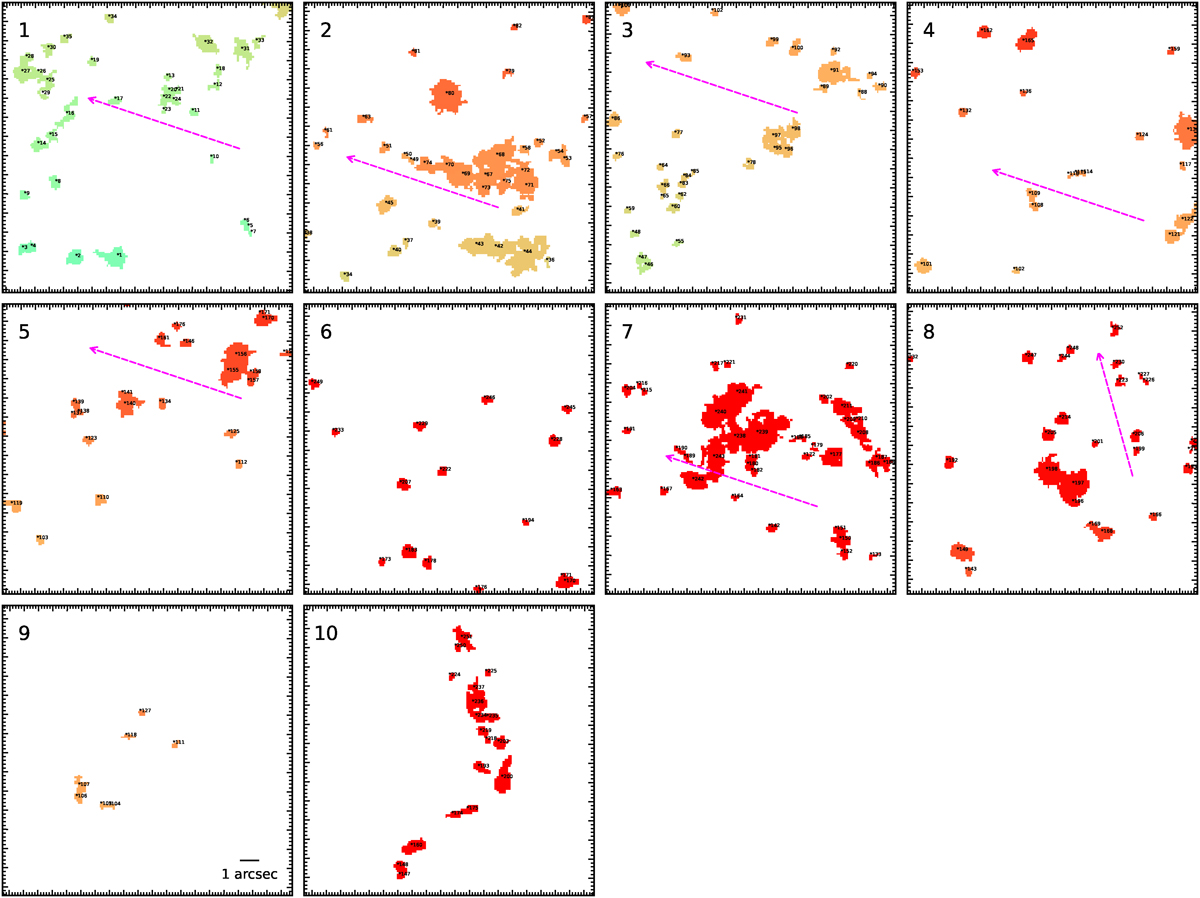
Zoom-in on the segmentation map of region selected from IE imaging of stripped features for UGC 2665. Each box has a size of 5.1 kpc × 4.4 kpc with the arcsec bar shown corresponding to 338 pc at cluster frame. The details of markers are the same as in Fig. 3. Segments are marked with individual identification number with colour scale to red shows the progressing identification number.
Current usage metrics show cumulative count of Article Views (full-text article views including HTML views, PDF and ePub downloads, according to the available data) and Abstracts Views on Vision4Press platform.
Data correspond to usage on the plateform after 2015. The current usage metrics is available 48-96 hours after online publication and is updated daily on week days.
Initial download of the metrics may take a while.