| Issue |
A&A
Volume 701, September 2025
|
|
|---|---|---|
| Article Number | A132 | |
| Number of page(s) | 9 | |
| Section | Astronomical instrumentation | |
| DOI | https://doi.org/10.1051/0004-6361/202555346 | |
| Published online | 12 September 2025 | |
Shared-optical-path VLBI frequency phase transfer from 86 to 258 GHz on an 8600km baseline
Demonstrated with the APEX and IRAM 30m telescopes
1
Max-Planck-Institut für Radioastronomie,
Auf dem Hügel 69,
53121
Bonn,
Germany
2
Astronomy Department, Universidad de Concepción,
Casilla 160-C,
Concepción,
Chile
3
Institut de Radioastronomie Millimétrique (IRAM),
Avenida Divina Pastora 7, Local 20,
18012
Granada,
Spain
4
Department of Space, Earth and Environment, Chalmers University of Technology, Onsala Space Observatory,
43992
Onsala,
Sweden
5
Finnish Centre for Astronomy with ESO, University of Turku,
Turku
20014 Finland
6
Aalto University Metsähovi Radio Observatory,
Metsähovintie 114,
02540
Kylmälä,
Finland
7
European Southern Observatory,
Alonso de Córdova 3107,
Vitacura Casilla
7630355,
Santiago,
Chile
8
Centro de Astro-Ingeniería, Pontificia Universidad Católica de Chile,
Casilla
306,
Santiago,
Chile
9
Institut de Radioastronomie Millimétrique (IRAM),
300 rue de la Piscine,
38406
Saint Martin d’Hères,
France
10
International Centre for Radio Astronomy Research, M468, The University of Western Australia,
35 Stirling Hwy,
Perth,
WA
6009,
Australia
11
Observatorio Astronómico Nacional (IGN),
Alfonso XII, 3 y 5,
28014
Madrid,
Spain
★ Corresponding author: This email address is being protected from spambots. You need JavaScript enabled to view it.
Received:
30
April
2025
Accepted:
7
July
2025
Abstract
Context. The receiver N3AR operating at a frequency range between 67 and 116 GHz was commissioned at the APEX telescope in October 2024. It adds a new low-frequency band for APEX, with the capability of simultaneous dual-frequency observations using a dichroic beamsplitter. The 3 mm receiver also allows APEX to join the existing 3 mm global very long baseline interferometry (VLBI) network.
Aims. One of our commissioning goals was to perform simultaneous dual-band VLBI observations at 86 and 258 GHz using receivers with shared optical paths (SOPs) to correct the atmospheric phase fluctuations using the frequency phase transfer (FPT) technique. This was possible together with the IRAM 30 m telescope, which has already developed such a capability. We aimed to verify the expected phase coherence and sensitivity improvement at the higher frequency achievable by applying FPT.
Methods. With the dual-band, single baseline data, we applied the FPT method, which uses the lower-frequency data to correct the simultaneously observed higher-frequency data. We evaluated the improvement compared to the conventional single-band observing mode by analyzing the coherence factor in the higher-frequency data.
Results. Our results show that the phase fluctuations at the two bands correlate well. After applying FPT, the interferometric phases at the higher frequency vary much less, and the coherence factor is significantly improved.
Conclusions. Our analysis confirms the feasibility of applying FPT to frequencies above 250 GHz with SOP receivers. Future observations in this mode could dramatically improve the sensitivity and imaging fidelity of high-frequency VLBI.
Key words: instrumentation: high angular resolution / methods: data analysis / techniques: high angular resolution / techniques: interferometric / galaxies: active
Deceased.
© The Authors 2025
 Open Access article, published by EDP Sciences, under the terms of the Creative Commons Attribution License (https://creativecommons.org/licenses/by/4.0), which permits unrestricted use, distribution, and reproduction in any medium, provided the original work is properly cited.
This article is published in open access under the Subscribe to Open model.
Open Access funding provided by Max Planck Society.
1 Introduction
Very long baseline interferometry (VLBI) at short millimeter wavelengths has provided the sharpest view of active galaxies, including the shadows of supermassive black holes (e.g., Event Horizon Telescope Collaboration 2019a, 2022) and the innermost jet region in active galactic nuclei (AGNs; e.g., Kim et al. 2020; Janssen et al. 2021; Issaoun et al. 2022; Jorstad et al. 2023; Paraschos et al. 2024; Baczko et al. 2024; Lu et al. 2023; Ros et al. 2024). However, the conventional single-band observing mode still faces severe challenges posed by the comparatively lower instrumental efficiencies and the increasingly turbulent atmospheric conditions at shorter wavelengths (Event Horizon Telescope Collaboration 2019b; Ros et al. 2024). The latter factor typically limits the time coherence of VLBI measurements to ≲10 λ/mm seconds, with a correspondingly poorer fringe detection sensitivity (e.g., Lobanov 2024). Recent developments of multiband receivers with shared optical paths (SOPs) present new opportunities to overcome these challenges (e.g., Han et al. 2013). Thanks to the nondispersive nature of the tropospheric effects, simultaneous dual-band/multiband VLBI observations have enabled the application of the frequency phase transfer (FPT) method (e.g., Rioja & Dodson 2011; Middelberg et al. 2005) to calibrate these effects in high-frequency data. As a result, the coherence time in the high-frequency data can be extended by orders of magnitude after applying FPT from the lower-frequency data. These opportunities have been explored by the Korean VLBI Network (KVN) and have garnered significant global attention in recent years (Rioja et al. 2014, 2015; Algaba et al. 2015; Yoon et al. 2018; Zhao et al. 2019). Future observations with upgraded global VLBI networks with SOP receivers will bring improvements of more than an order of magnitude in the sensitivity and dynamic range of millimeter-VLBI imaging and deliver astrometric measurements with an accuracy of a few microarcseconds. The exceptional resulting discovery potential would strongly impact a number of scientific fields (e.g., Dodson et al. 2017, 2023).
Frequency phase transfer has been successfully validated with the KVN at frequencies up to 130 GHz and baselines of about 500 km (e.g., Rioja et al. 2015; Algaba et al. 2015; Yoon et al. 2018). While FPT is also expected to play an important role in VLBI observations made at higher frequencies and longer baselines (e.g., Dodson et al. 2017; Rioja et al. 2023; Issaoun et al. 2023; Jiang et al. 2023), only limited success has been achieved so far with its applications under such settings (Sohn et al. 2018). The IRAM 30-m radio telescope located in Pico Veleta (PV), Spain, is able to support simultaneous dual-band operations using the EMIR receiver (Carter et al. 2012), yet the number of partner stations with compatible SOP receivers remains small. As an alternative to SOP receivers, colocated antennas can also pair up to achieve simultaneous dual-band observations (Asaki et al. 1998). Recently, observations at 86 and 215 GHz were conducted by Issaoun et al. (2025) using the IRAM 30 m telescope (dual-band) and two stations in Hawaii, the James Clerk Maxwell Telescope (JCMT) and the Submillimeter Array (SMA), which are located in close proximity (~160m apart, observing at one band each). The analysis has shown that the visibility phases at the two frequencies are strongly correlated, and the application of FPT could systematically increase the coherence level at the higher frequency. However, the atmospheric conditions above the two stations in Hawaii are not identical due to the difference in their physical locations. A rate-removal step, per frequency and scan, was applied prior to the analysis of the correlations of the phases at the two bands and FPT. This could limit the application of FPT with the paired-antenna method for weaker sources or require improved schemes for instrumental calibration.
The Atacama Pathfinder EXperiment (APEX, Güsten et al. 2006) is a 12 meter telescope located in the Atacama desert in Chile at an altitude of 5104 m. In September 2024, a new 3 mm APEX receiver (N3AR) developed at the Max-Planck-Institut für Radioastronomie (MPIfR) in Bonn was successfully installed. N3AR can operate concurrently with the existing receivers in the 230, 345, 460, or 690 GHz bands (nFLASH230, SEPIA345, nFLASH460, SEPIA690, see Appendix A). The antenna participated subsequently in the Global mm-VLBI array (GMVA) session (see Ros et al. 2024) in mid-October 2024. With this upgrade, we could form an intercontinental baseline between APEX and the IRAM 30 m telescope that is capable of performing simultaneous 86 and 258 GHz VLBI observations with SOP receivers. A test observation was carried out on November 20, 2024. Before the dual-band test, both telescopes had operated successfully in single-band mode at 230, 260, and 345 GHz with the Event Horizon Telescope (EHT) since 2017 (Event Horizon Telescope Collaboration 2019b; Raymond et al. 2024). The IRAM 30 m telescope also participates regularly in the GMVA that operates at 86 GHz. In this paper, we report the results of the first dual-band test.
2 Observations and data analysis
The 86/258 GHz FPT observations took place from 21:00 UT on November 20, 2024, to 01:00 UT on the following day with the APEX and the IRAM 30m telescopes. The baseline length between the two sites was 8623 km (Appendix B). The weather conditions were good at both sites during the observation. The 225 GHz zenith opacity, τ225, was around 0.09 and 0.3 at APEX and IRAM 30m, respectively. The reference frequencies were set to 86.012 and 258.036 GHz, with an integer ratio of three between the frequencies. APEX had continuous phase-cal tone injection in both receivers for monitoring the instrumental phase drift between the receivers. The recording bandwidth was 1024 MHz at each band. APEX recorded dual circular polarization, and IRAM 30 m telescope recorded dual linear polarization.
A total of eight sources (3C 454.3, CTA 102, PKS B2201+171, TXS 2201+315, BL Lac, IVS B2215+150, PKS B0420-014, and 3C 120) were observed. We recorded three scans every 30 minutes with a duration of ~5.5 minutes each. Two-minute gaps were inserted between scans to slew the antenna and measure the system temperatures. The last 8 minutes of each 30-minute block were dedicated to doing pointing checks with bright planets. The first 30 minutes (21:00– 21:30 UT) were lost due to a power issue with the digital backend at IRAM. APEX lost two scans due to an antenna control error, one in the first 30 minutes and another one at 00:37:30 UT. In total, we recorded 20 scans of good data of the eight targets. In this paper, we focus on the data of CTA 102 and 3C 454.3. Each of the two sources was observed in three scans, with elevations ranging from 46° to 55° at APEX and from 47° to 25° at IRAM 30 m (see Appendix B). The two sources are close to each other in the sky (~6.8° apart), and the scans are close in time.
The correlation of the observed data was performed with the DiFX software correlator (Deller et al. 2011) installed in the MPIfR cluster. The frequency resolution was set to 0.5 MHz and the time-averaging period to 0.4 s. Fringes at both observing bands were successfully detected.
The correlated data were analyzed with AIPS in two separate datasets for calibration and the FPT analyses. Prior to fringe-fitting, corrections for the Earth orientation parameters and the ionospheric dispersive delays were applied. The phase-cal tones for APEX were also loaded and applied to the data. We first ran fringe-fitting over a short segment (30 seconds) of the data to initially align the phases across the bands, a step known as manual-pcal. We then ran a global fringe-fit over the full dataset to determine the multiband delay, delay rate, and phases. The solution interval was set to 10 seconds at both bands, and each solution was shifted by 5 seconds from the previous one (i.e., SOLINT=10/60; SOLSUB=2). Figure 1 shows the solutions at both bands on one scan of CTA 102 that was taken after sunset at APEX and around midnight at IRAM. As is visible from the top panel, the higher-frequency (258 GHz) phases vary much faster and could reach 2π in about 1 minute, which prevents the detection of faint targets with longer coherent integration times. Nevertheless, the phase fluctuations at the higher frequency could be reproduced well by the ones at the lower frequency (86 GHz) after being scaled by the frequency ratio (3 in this case, Figure 1, middle). In the FPT step, the phase solutions from the lower frequency band were scaled up by the frequency ratio and applied to the higher frequency. The multiband delay and delay-rate solutions were also applied (see e.g., Rioja et al. 2015; Zhao et al. 2019, for details of the FPT analysis step).
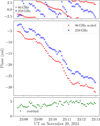 |
Fig. 1 Top: Fringe-fitting phase solutions of the scan at 23:07:30 on CTA 102 at 86 (red dots) and 258 GHz (blue crosses). Middle: Unwrapped phase solutions by addressing the 2π ambiguities and scaled by the ratio R=258 GHz/ν for ν=86 GHz and ν=258 GHz, respectively. Bottom: Residual between the phases shown in the middle panel. The source elevation was 55° and 27° at APEX and IRAM 30 m, respectively. |
3 Results
As is shown in Figure 1, the phases at the two frequencies correlate well. We can expect the visibility phases after applying FPT to show improved data quality. In Figure 2, the phases of CTA 102 and 3C 454.3 at 258 GHz before and after FPT are shown. As is obvious from the figures, the phases before FPT, which are equivalent to the phases with only single-band observations, show much faster phase variations, indicating that the phases are corrupted by short-timescale propagation effects. However, the strong correlation between bands and the 1:3 ratio of the phase rates in Figure 1 indicate that the dominating propagation effects are nondispersive and can be corrected by FPT. The phases after FPT exhibit only slow variations. The range of the phase fluctuations within a scan after sunset reduces from 26 rad before FPT to 1.2 rad after FPT, which corresponds to a scan-averaged phase rate of 13 and 0.6 mHz before and after FPT, respectively. For the scans before sunset, the ranges change from 16~30rad to 3~5 rad. The residual phases of the two sources on neighboring scans have similar phase rates, which hints at the possibility of using one source to calibrate the other, i.e., the so-called source-frequency phase referencing method (see Appendix C).
To quantify the coherence of the data and compare the cases before and after FPT, we analyzed the coherence factor,
![Mathematical equation: C(T)=\left|\frac{1}{T}\int_{0}^{T}\exp[i\phi(t)]{\rm d}t\right|](/articles/aa/full_html/2025/09/aa55346-25/aa55346-25-eq1.png) (1)
(1)
where T is the time interval in which the coherence factor is examined, and φ(t) is the visibility phase at time t (Thompson et al. 2017). The coherence factor is defined to be 1.0 when the data are perfectly coherent. In Figure 3, the coherence factors before and after FPT are shown for the scan of CTA 102 starting at 23:07:30 UT (as is shown in Figure 1). The coherence factor curve without FPT decreases steeply with increasing integration time. The value drops below 0.9 when the integration time is longer than ~10 seconds, and reaches 0.6 at ~20 seconds. On the contrary, the curve resulting from applying FPT shows a milder decline over time. At all integration intervals within the scan, the values stay above the curve obtained without FPT (see also Figures D.2–D.4). For an integration time within one minute, the coherence factor stays higher than 0.9 and remains around 0.8 for longer intervals up to the scan length of 5 minutes. Improvement of the coherence by FPT can also be found in other scans and sources (see Appendix D).
4 Discussion
The short-timescale tropospheric turbulence has posed major challenges to conventional single-band VLBI observations at millimeter wavelengths. Nonetheless, the nondispersive nature of these effects has motivated significant developments of SOP receivers that could enable the application of FPT to calibrate these effects. Successful validations at wavelengths longer than 2 mm have been achieved in past decades. Simultaneous dual-band observations have now become available at shorter wavelengths with facilities capable of conducting VLBI observations at the highest frequencies so far (345 GHz, see Raymond et al. 2024). While the nondispersive property would still be valid in this frequency range, successful applications of FPT would rely on the instrumental phase stability of the participating stations. Our present results have thus confirmed that the current state-of-the-art design of SOP receivers is valid at high frequencies.
The dispersive propagation phase terms, such as ionospheric and instrumental phases, along with the source structure, are the main sources of residual phases after FPT. We note that on several scans of our observations, the FPT residual phases vary faster than the ones seen at lower-frequency pairs (e.g., Rioja et al. 2015; Algaba et al. 2015), whereas the expected ionospheric effects are much less at higher frequencies. The observations occurred during nighttime at the IRAM 30 m site. However, the difference before and after sunset at APEX (see Figure 2) still indicates noticeable ionospheric contributions during daytime. This can be explained as the solar activity was high in 2024 (e.g., Jouve et al. 2025), and the APEX site is near the geomagnetic equator. The similarity of the phases between sources suggests it is less likely to be dominated by source structure. One potential instrumental cause would be the alignment of the primary beams at the two frequencies at APEX because the two receivers are located in different cabins and focus positions. Another potential cause is phase drift between the receivers. APEX had continuous tone injection to measure and correct the inter-receiver phase offset, but IRAM 30 m lacked such a system that could operate during the astronomical observation. Compared to the recent work by Issaoun et al. (2025), the coherence factor without FPT in our case is lower (reaching ∼0.2 compared to ∼0.6). This is mainly because we do not need to apply the rate-removal process, and the sky opacity is higher in our case (τ225 ∼0.3 compared to 0.25 at IRAM 30 m). However, the coherence after FPT is comparable in the two cases, despite the higher frequency and sky opacity in our case. This could also point to common instrumental contributions as the limiting factors and underscores the need for continuous tone injection in both bands to stabilize the relative phase between the receivers. We note that the beam alignment at APEX is expected to be improved in March 2025, and tone injection at IRAM 30 m is being reconfigured to permit continuous injection during observations, so future observations might show reduced residual phases and further improved phase coherence.
Recent works have demonstrated the feasibility of applying FPT on intercontinental baselines and at high frequencies (e.g., Zhao et al. 2019; Issaoun et al. 2025, and this work). In the future, the use of FPT will become more common for millimeter-VLBI observations with global VLBI networks. The FPT mode will become a regular part of the GMVA sessions in the coming years (Lobanov 2024). At frequencies above 150 GHz, the increasing number of EHT telescopes with SOP receivers will greatly improve the baseline sensitivity and image dynamic ranges (an order of magnitude higher, see e.g., Lobanov 2024; Dodson et al. 2023) of future observations. Furthermore, the APEX receiving system could also support simultaneous observations at 86 and 345 GHz. An FPT test could be scheduled in the near future with, for example, the paired antennas in Hawai’i or another upcoming station with SOP receivers.
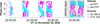 |
Fig. 2 Interferometric phases of CTA 102 and 3C 454.3 at 258.036 GHz before (magenta) and after (cyan) applying FPT. The data are averaged over 2 seconds and across the bandwidth. The shaded area indicates the time after sunset at APEX. |
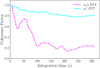 |
Fig. 3 Coherence factor before and after applying FPT for the CTA 102 scan at 23:07:30. |
5 Conclusions and future aspects
Motivated by the installation of the new N3AR receiver at APEX and the existing SOP receivers at the IRAM 30m telescope (Carter et al. 2012), we have performed the first simultaneous 86 and 258 GHz VLBI observations. The observations were carried out on November 20, 2024, and dual-band fringes were successfully obtained.
Our analyses have shown that FPT is successfully applied up to 258 GHz, which is the highest frequency at which this method has been performed on an intercontinental baseline. The coherence time is extended from ∼10 seconds to ∼1 minute by FPT. The residual phases between nearby sources also trace each other. This success paves the way for more FPT tests in the future with a sufficient number of telescopes, enabling high-dynamic-range imaging and high-precision (microarcsecond-level) relative astrometry at high frequencies.
Acknowledgements
We are grateful to all the scientific and technical staff involved in the commissioning of the APEX N3AR receiver and in previous dualband tests with IRAM. We also thank Dr. Sergio A. Dzib-Quijano for carefully reading the manuscript and providing helpful comments. This work was supported by the European Union Horizon 2020 research and innovation programme under grant agreements RadioNet (No. 730562), M2FINDERS (No. 101018682). APEX is a collaboration between the Max-Planck-Institut für Radioastronomie (Germany), ESO, and the Onsala Space Observatory (Sweden). The IRAM 30m telescope on Pico Veleta, Spain is operated by IRAM and supported by CNRS (Centre National de la Recherche Scientifique, France), MPG (Max-Planck-Gesellschaft, Germany), and IGN (Instituto Geográfico Nacional, Spain). The quarter-wave plate used at APEX was designed by Anne-Laure Fontana at IRAM. This research has made use of the following software packages: DiFX (Deller et al. 2011), AIPS (Greisen 2003), ParselTongue (Kettenis & Sipior 2012), SMILI (Akiyama et al. 2017), Matplotlib (Hunter 2007), Altair (Vander-Plas et al. 2018), pandas (McKinney et al. 2010), numpy (Harris et al. 2020), GeoPandas (Jordahl et al. 2020).
Appendix A N3AR - a new 3 mm receiver and dual-band capability at the APEX telescope
The new 3 mm APEX receiver (N3AR) was designed and built by the Sub-mm Group at the MPIfR. It was installed at the APEX telescope in September 2024 and commissioned in October 2024 with VLBI observations in the GMVA at 86 GHz. The dual-band capability was commissioned in November 2024 with the shared-optics FPT observation described in this paper.
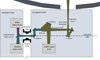 |
Fig. A.1 Optical path and block schematic of the APEX receivers. |
The receiver optical path and block schematic are shown in Figure A.1. The relay optics are designed to illuminate the secondary mirror with an edge taper of 12.5 dB. The beam clearance at the edge of the optical elements is 4 omega.
The receiver has cooled high-electron-mobility transistor (HEMT) amplifiers covering the band 67 to 116 GHz. The Dewar output is at radio frequency (RF), and downconversion to an intermediate frequency (IF) of 1.5–20 GHz is performed in a room–temperature sideband–separating downconverter module from RPG (Radiometer Physics GmbH). The local oscillator (LO) is derived from a VDI synthesizer in the range 8-20 GHz followed by a ×8 multiplier chain. The receiver provides a total of 4 × 18 GHz IF bands, being dual native-linear polarizations and two sidebands. Calibration of receiver temperature (Trec) is performed with hot (348 K) and cold (290 K) loads. Switching optics can send the beam to the sky or hot or cold load, where the hot load is a heated, thermally isolated, absorber-coated cone, and the cold load is an absorber made of TK Instrument’s RAM tiles at cabin ambient temperature.
A dichroic beamsplitter is inserted in the existing optical path in the Cassegrain cabin to reflect the 3 mm band to the N3AR receiver and allow higher frequencies to pass to the existing Nasmyth A Cabin receivers nFLASH-230 or SEPIA-345 (Belitsky et al. 2018; Meledin et al. 2022). Those cover the bands 196–281 GHz and 272–376 GHz respectively, any of which can be operated simultaneously with N3AR. The dichroic beamsplitter consists of two parallel, cross-wired grids. The wire pitch (500 μm) sets the 3 mm reflectivity, and the separation between the two grids sets the frequency at which peak transmission occurs. The N3AR receiver is optically aligned with the nFLASH receiver to achieve concentric beams on the sky.
A frequency comb for receiver phase stabilization is generated with a Schottky diode mixer (Pacific Millimeter WM) pumped in the range 14 to 19 GHz with an Agilent 8257D synthesizer and amplifier Microsemi AML618P2501 and radiated with a standard pyramidal horn alongside the beam from approximately the 5 omega border of the astronomical beam. The tone power drops off strongly with frequency. This required an equalizer, realized as a waveguide filter, to attenuate the 3 mm band to prevent saturation of N3AR while having enough power in nFLASH at 258 GHz. The comb is needed to remove the relative instrumental phase drift between N3AR and the Nasmyth cabin receivers. The drift occurs due to different temperature environments and different cable runs transporting the maser 10 MHz reference. The phase-cal tone is recorded along with the astronomical signal with the VLBI backend and the tone phase time series is extracted in the correlator for both receiver bands and used to correct the astronomical visibility phase time series. An example of the tone phase time series is shown in Figure A.2, and displays phase rates of —5 and −14 deg/min at 86 and 258 GHz.
A quarter-wave plate provides conversion between dual circular polarization on the sky for VLBI and dual linear polarization that is native for the receiver. The plate was designed at IRAM in grooved Teflon and was used for the Plateau de Bure interferometer prior to upgrade as NOEMA.
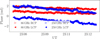 |
Fig. A.2 APEX phase-cal tones phases at the two observed frequencies the CTA 102 scan at 23:07:30. |
Appendix B Antenna locations and source elevations
In section 2, we described the first simultaneous 86 & 258 GHz dual-band observations on November 20, 2024. The observations were jointly carried out with the APEX and IRAM 30-m telescope. In Figure B.1, we show the locations of the telescopes on a map.
Eight sources with right ascension between 22h00m and 04h00m were observed. All sources were detected previously with the GMVA at 86 GHz (Nair et al. 2019). Five of the targets (3C 454.3, CTA 102, BL Lac, PKS B0420-014, 3C 120) have a total flux higher than 1.5 Jy (e.g, Nair et al. 2019). The other three (PKS B2201+171, TXS 2201+315, IVS B2215+150) are fainter but are close to the bright sources (< 11°). The 3C 454.3 and CTA 102 results shown in this paper were obtained during UT 22:00 – 23:15. A summary of the target source, UT range, and elevations of each scan can be found in Table B.1.
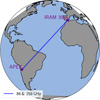 |
Fig. B.1 The location of the antennas participated in the 86 & 258 GHz dual-band VLBI observations on November 20, 2024. |
Appendix C Source-frequency phase referencing
Frequency phase transfer could calibrate the rapidly varying tropospheric phase errors in the higher frequency band, along with all other nondispersive phase effects, like those due to antenna and source position errors. However, the dispersive propagation effects, like ionospheric and instrumental phase errors, will remain in the FPT residual data. Nevertheless, these effects vary slowly in time – meaning that FPT will still extend the coherence time (see section 3) – making it possible to perform fringe-fitting with a much longer integration time. Alternatively, it is also possible to calibrate these remaining effects by phase referencing the FPT residual phase to that of a nearby source because these effects also change only mildly with direction. This method is called source-frequency phase referencing (SFPR) and would require alternating the scans between two or more sources. SFPR can not only calibrate all the remaining propagation effects, but it also preserves the astrometric information. For details, please refer to e.g., Rioja & Dodson (2011, 2020).
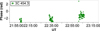 |
Fig. C.1 The interferometric phases of 3C 454.3 at 258.036 GHz after applying SFPR. The reference source for SFPR was CTA 102. The FPT was performed from the 86.012 GHz data of the same source. The data are averaged over 5 seconds. |
In our experiment, the targets CTA 102 and 3C 454.3 were ~6.8 degrees from each other. Our results confirmed that the FPT residual phases of the two sources follow a similar trend. The average phase rates at 258 GHz data after FPT for both sources are −1.2—1.7 mHz and —0.6 mHz before and after APEX sunset. In this appendix, we show the results from calibrating the dispersive effects in the FPT residual of 3C 454.3 using CTA 102 as the reference source. The phases after this step are shown in Figure C.1. The residual phases after SFPR show a smooth variation of 1.5 radian in 1 hour, which corresponds to a phase rate of 0.07 mHz. The SFPR residual phases should consist only of the information on source structure, source position, and interpolation error (see e.g., Rioja & Dodson 2011). However, we want to note that in our experiment, the effective switching cycle between sources is 30 minutes. This time is much longer than the coherence time after FPT, so the calibration would be subop-timal. Based on our findings that the coherence factor is around 0.8 at 5 minutes, and considering the actual slewing speed of the antennas and the overhead time required to measure system temperatures and so on would require ~1.5 minutes, we would recommend that a source switching cycle of 5 to 10 minutes for future SFPR tests in this frequency range. Future tests with more baselines would also provide constraints on the source structure using closure quantities (e.g., Blackburn et al. 2020). Altogether, this will result in high-precision astrometric measurements of the ultracompact sources at the highest frequencies (e.g., Rioja & Dodson 2020; Jiang et al. 2023; Lobanov 2024).
Appendix D FPT and coherence analysis on other scans and sources
Besides CTA 102 and 3C 454.3, six more sources were also observed in our FPT test (see Appendix B). We briefly summarize the data properties here.
PKS B0420-014 and 3C 120 were observed in the last 30 minutes (00:30–01:00 UT). For these two sources, fringes at 258 GHz could not be directly detected with a sufficient signal-to-noise ratio (s/n). Nevertheless, the data could be recovered after applying FPT from 86 GHz. In Figure D.1, we show the interferometric phases of these two sources at 258 GHz before and after applying FPT. Same as in Figure 2, FPT from 86 GHz could significantly improve the coherence in the high frequency data. The phase rates after FPT were 0.5, 2.4, and −1.9 mHz, for the three scans respectively, while the data before FPT are dominated by noise. We note, however, in the case of 3C 120, the data are still affected by comparatively large thermal noise due to the low elevation of the source at APEX during the scan (19°).
For the three faint targets, PKS B2201+171, TXS 2201+315, and IVS B2215+150, few fringe detections at 86 GHz were obtained with the same setups (i.e., 10-second solution interval, s/n threshold of 5), which prevents us from applying FPT.
BL Lac was observed on 6 scans during 21:30–22:00UT and 23:30–00:30 UT. While we also see significant coherence improvements at 258 GHz after applying FPT, the residual phases still show faster variations, roughly three times that of the other four sources (CTA 102, 3C 454.3, PKS B0420-014, & 3C 120). This fast variation might have a source-intrinsic origin, indicating an offset between the emission region at the two frequencies, or an ionospheric and/or instrumental origin as discussed in section 4 due to the low elevation. Further analysis is necessary to better understand the data, and the results will be presented in forthcoming publications.
Scan summary of the 86/258 GHz FPT test on November 20, 2024
In Figure 3, we show the coherence analysis on the CTA 102 scan at 23:07:30 UT. In Figures D.2–D.4, we show the same results on the other scans of CTA 102, and the scans of 3C 454.3, and PKS B0420-014. The first scan of 3C 454.3 is excluded due to a limited number of data points (see Figure 2). In almost all scans, the coherence factor for the data after FPT remains higher than the counterpart before applying FPT. At a timescale of 1 minute, the coherence factor after FPT scales around 0.8–0.9, while the values before FPT show more distinct values, which could be related to the turbulent nature of the troposphere, but on most scans, the factor without FPT falls below 0.5 in 2 minutes or shorter. At a 5-minute timescale, the coherence factor after FPT ranges between 0.5 and 0.8, in contrast to 0.1–0.4 without FPT.
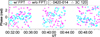 |
Fig. D.1 Same as Figure 2 but for PKS B0420-014 and 3C 120. The data were averaged in 5 seconds. The longer averaging time compared to that for CTA 102 and 3C 454.3 is for reducing the thermal noise in the data. |
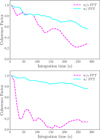 |
Fig. D.2 Same as Figure 3 but for the other CTA 102 scans at 22:15:00 (top) and 22:37:30 (bottom), respectively. |
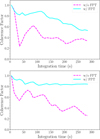 |
Fig. D.3 Same as Figure 3 but for the 3C 454.3 scans at 22:30:00 (top) and 23:00:00 (bottom), respectively. |
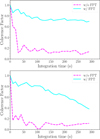 |
Fig. D.4 Same as Figure 3 but for the PKS B0420-014 scans at 00:30:00 (top) and 00:45:00 (bottom), respectively. |
References
- Akiyama, K., Ikeda, S., Pleau, M., et al. 2017, AJ, 153, 159 [NASA ADS] [CrossRef] [Google Scholar]
- Algaba, J.-C., Zhao, G.-Y., Lee, S.-S., et al. 2015, J. Korean Astron. Soc., 48, 237 [Google Scholar]
- Asaki, Y., Shibata, K. M., Kawabe, R., et al. 1998, Rad. Sci., 33, 1297 [Google Scholar]
- Baczko, A.-K., Kadler, M., Ros, E., et al. 2024, A&A, 692, A205 [NASA ADS] [CrossRef] [EDP Sciences] [Google Scholar]
- Belitsky, V., Lapkin, I., Fredrixon, M., et al. 2018, A&A, 612, A23 [NASA ADS] [CrossRef] [EDP Sciences] [Google Scholar]
- Blackburn, L., Pesce, D. W., Johnson, M. D., et al. 2020, ApJ, 894, 31 [Google Scholar]
- Carter, M., Lazareff, B., Maier, D., et al. 2012, A&A, 538, A89 [NASA ADS] [CrossRef] [EDP Sciences] [Google Scholar]
- Deller, A. T., Brisken, W. F., Phillips, C. J., et al. 2011, PASP, 123, 275 [Google Scholar]
- Dodson, R., Rioja, M. J., Jung, T., et al. 2017, New A Rev., 79, 85 [Google Scholar]
- Dodson, R., García-Miró, C., Giroletti, M., et al. 2023, arXiv e-prints [arXiv:2306.04516] [Google Scholar]
- Event Horizon Telescope Collaboration (Akiyama, K., et al.) 2019a, ApJ, 875, L1 [Google Scholar]
- Event Horizon Telescope Collaboration (Akiyama, K., et al.) 2019b, ApJ, 875, L2 [Google Scholar]
- Event Horizon Telescope Collaboration (Akiyama, K., et al.) 2022, ApJ, 930, L12 [NASA ADS] [CrossRef] [Google Scholar]
- Greisen, E. W. 2003, Astrophys. Space Sci. Lib., 285, 109 [NASA ADS] [Google Scholar]
- Güsten, R., Nyman, L. Å., Schilke, P., et al. 2006, A&A, 454, L13 [NASA ADS] [CrossRef] [EDP Sciences] [Google Scholar]
- Han, S.-T., Lee, J.-W., Kang, J., et al. 2013, PASP, 125, 539 [Google Scholar]
- Harris, C. R., Millman, K. J., van der Walt, S. J., et al. 2020, Nature, 585, 357 [NASA ADS] [CrossRef] [Google Scholar]
- Hunter, J. D. 2007, Comput. Sci. Eng., 9, 90 [NASA ADS] [CrossRef] [Google Scholar]
- Issaoun, S., Wielgus, M., Jorstad, S., et al. 2022, ApJ, 934, 145 [NASA ADS] [CrossRef] [Google Scholar]
- Issaoun, S., Pesce, D. W., Roelofs, F., et al. 2023, Galaxies, 11, 28 [Google Scholar]
- Issaoun, S., Pesce, D. W., Rioja, M. J., et al. 2025, AJ, 169, 229 [Google Scholar]
- Janssen, M., Falcke, H., Kadler, M., et al. 2021, Nat. Astron., 5, 1017 [NASA ADS] [CrossRef] [Google Scholar]
- Jiang, W., Zhao, G.-Y., Shen, Z.-Q., et al. 2023, Galaxies, 11, 3 [Google Scholar]
- Jordahl, K., Van den Bossche, J., Fleischmann, M., et al. 2020, https://doi.org/10.5281/zenodo.3946761 [Google Scholar]
- Jorstad, S., Wielgus, M., Lico, R., et al. 2023, ApJ, 943, 170 [NASA ADS] [CrossRef] [Google Scholar]
- Jouve, L., Hung, C. P., Brun, A. S., et al. 2025, A&A, 699, A30 [NASA ADS] [CrossRef] [EDP Sciences] [Google Scholar]
- Kettenis, M., & Sipior, M. 2012, Astrophysics Source Code Library [recordascl:ascl:1208.020] [Google Scholar]
- Kim, J.-Y., Krichbaum, T. P., Broderick, A. E., et al. 2020, A&A, 640, A69 [EDP Sciences] [Google Scholar]
- Lobanov, A. P. 2024, in 16th European VLBI Network Symposium & Users Meeting. 2–5 September, 195 [Google Scholar]
- Lu, R.-S., Asada, K., Krichbaum, T. P., et al. 2023, Nature, 616, 686 [CrossRef] [Google Scholar]
- McKinney, W. et al. 2010, in Proceedings of the 9th Python in Science Conference, 445, Austin, TX, 51 [Google Scholar]
- Meledin, D., Lapkin, I., Fredrixon, M., et al. 2022, A&A, 668, A2 [NASA ADS] [CrossRef] [EDP Sciences] [Google Scholar]
- Middelberg, E., Roy, A. L., Walker, R. C., & Falcke, H. 2005, A&A, 433, 897 [NASA ADS] [CrossRef] [EDP Sciences] [Google Scholar]
- Nair, D. G., Lobanov, A. P., Krichbaum, T. P., et al. 2019, A&A, 622, A92 [NASA ADS] [CrossRef] [EDP Sciences] [Google Scholar]
- Paraschos, G. F., Kim, J. Y., Wielgus, M., et al. 2024, A&A, 682, L3 [NASA ADS] [CrossRef] [EDP Sciences] [Google Scholar]
- Raymond, A. W., Doeleman, S. S., Asada, K., et al. 2024, AJ, 168, 130 [NASA ADS] [CrossRef] [Google Scholar]
- Rioja, M., & Dodson, R. 2011, AJ, 141, 114 [Google Scholar]
- Rioja, M., & Dodson, R. 2020, A&A Rev., 28, 6 [Google Scholar]
- Rioja, M. J., Dodson, R., Jung, T., et al. 2014, AJ, 148, 84 [Google Scholar]
- Rioja, M. J., Dodson, R., Jung, T., & Sohn, B. W. 2015, AJ, 150, 202 [Google Scholar]
- Rioja, M. J., Dodson, R., & Asaki, Y. 2023, Galaxies, 11, 16 [Google Scholar]
- Ros, E., Krichbaum, T. P., Lobanov, A. P., et al. 2024, in 16th European VLBI Network Symposium & Users Meeting. 2–5 September, 159 [Google Scholar]
- Sohn, B. W., Giovannini, G., Giroletti, M., et al. 2018, in 14th European VLBI Network Symposium & Users Meeting (EVN 2018), 120 [Google Scholar]
- Thompson, A. R., Moran, J. M., & Swenson, Jr., G. W. 2017, Interferometry and Synthesis in Radio Astronomy, 3rd edn. (Hoboken: Wiley) [Google Scholar]
- VanderPlas, J., Granger, B., Heer, J., et al. 2018, J. Open Source Softw., 3, 1057 [Google Scholar]
- Yoon, D.-H., Cho, S.-H., Yun, Y., et al. 2018, Nat. Commun., 9, 2534 [NASA ADS] [CrossRef] [Google Scholar]
- Zhao, G.-Y., Jung, T., Sohn, B. W., et al. 2019, J. Korean Astron. Soc., 52, 23 [Google Scholar]
All Tables
All Figures
|
Fig. 1 Top: Fringe-fitting phase solutions of the scan at 23:07:30 on CTA 102 at 86 (red dots) and 258 GHz (blue crosses). Middle: Unwrapped phase solutions by addressing the 2π ambiguities and scaled by the ratio R=258 GHz/ν for ν=86 GHz and ν=258 GHz, respectively. Bottom: Residual between the phases shown in the middle panel. The source elevation was 55° and 27° at APEX and IRAM 30 m, respectively. |
| In the text | |
|
Fig. 2 Interferometric phases of CTA 102 and 3C 454.3 at 258.036 GHz before (magenta) and after (cyan) applying FPT. The data are averaged over 2 seconds and across the bandwidth. The shaded area indicates the time after sunset at APEX. |
| In the text | |
|
Fig. 3 Coherence factor before and after applying FPT for the CTA 102 scan at 23:07:30. |
| In the text | |
|
Fig. A.1 Optical path and block schematic of the APEX receivers. |
| In the text | |
|
Fig. A.2 APEX phase-cal tones phases at the two observed frequencies the CTA 102 scan at 23:07:30. |
| In the text | |
|
Fig. B.1 The location of the antennas participated in the 86 & 258 GHz dual-band VLBI observations on November 20, 2024. |
| In the text | |
|
Fig. C.1 The interferometric phases of 3C 454.3 at 258.036 GHz after applying SFPR. The reference source for SFPR was CTA 102. The FPT was performed from the 86.012 GHz data of the same source. The data are averaged over 5 seconds. |
| In the text | |
|
Fig. D.1 Same as Figure 2 but for PKS B0420-014 and 3C 120. The data were averaged in 5 seconds. The longer averaging time compared to that for CTA 102 and 3C 454.3 is for reducing the thermal noise in the data. |
| In the text | |
|
Fig. D.2 Same as Figure 3 but for the other CTA 102 scans at 22:15:00 (top) and 22:37:30 (bottom), respectively. |
| In the text | |
|
Fig. D.3 Same as Figure 3 but for the 3C 454.3 scans at 22:30:00 (top) and 23:00:00 (bottom), respectively. |
| In the text | |
|
Fig. D.4 Same as Figure 3 but for the PKS B0420-014 scans at 00:30:00 (top) and 00:45:00 (bottom), respectively. |
| In the text | |
Current usage metrics show cumulative count of Article Views (full-text article views including HTML views, PDF and ePub downloads, according to the available data) and Abstracts Views on Vision4Press platform.
Data correspond to usage on the plateform after 2015. The current usage metrics is available 48-96 hours after online publication and is updated daily on week days.
Initial download of the metrics may take a while.