Fig. 3.
Download original image
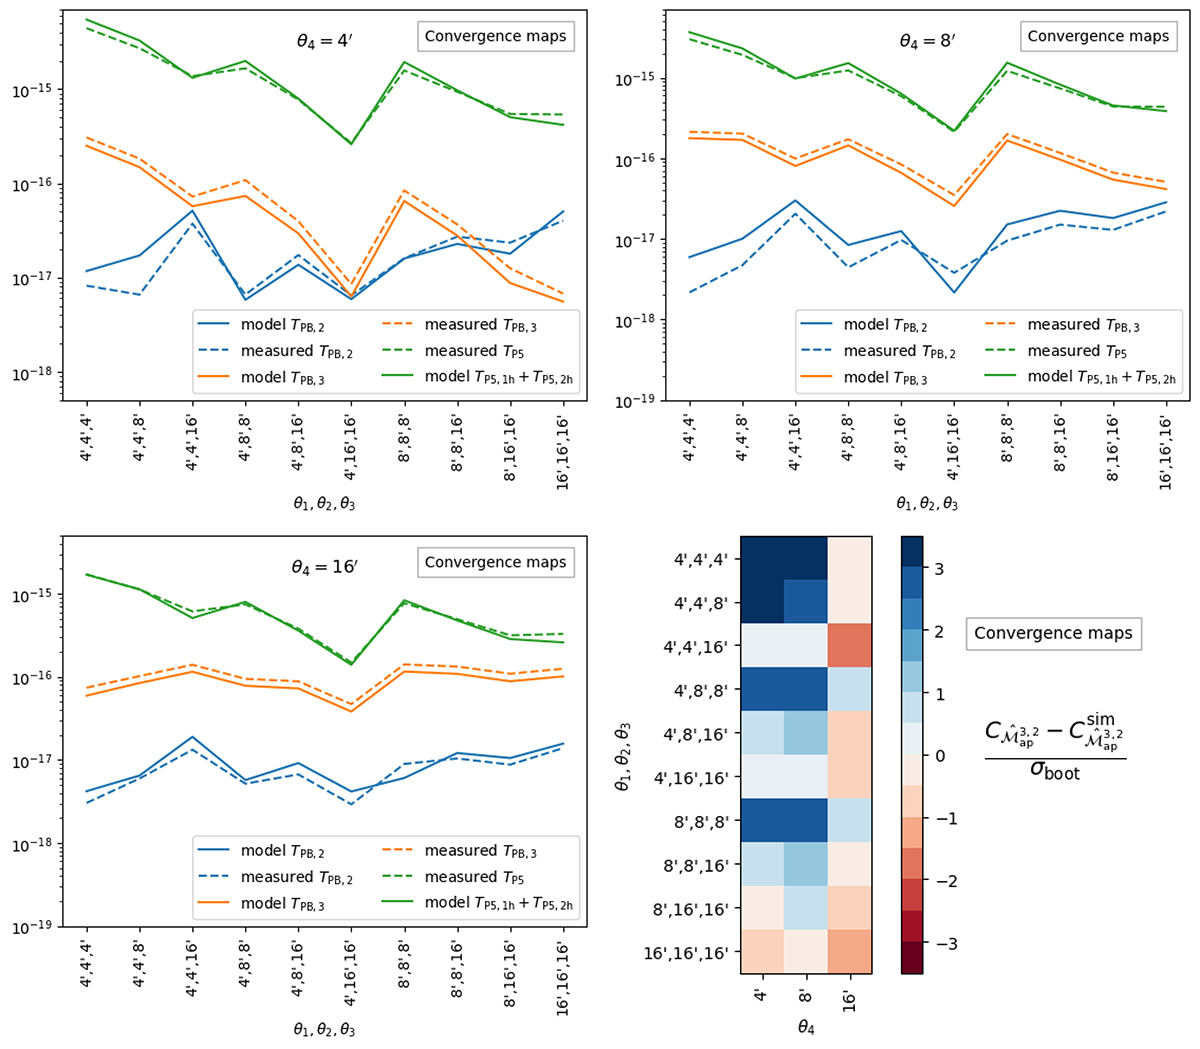
Individual terms of the model cross-covariance, plotted together with the numerically measured ones of the SLICS without shape noise (convergence maps). The top left plot displays the terms when fixing θ4 = 4′, the top right when fixing θ4 = 8′, and the bottom left fixing θ4 = 16′. The bottom right heat map shows the difference between the modelled cross-covariance and the sample covariance normalised by the bootstrapping error.
Current usage metrics show cumulative count of Article Views (full-text article views including HTML views, PDF and ePub downloads, according to the available data) and Abstracts Views on Vision4Press platform.
Data correspond to usage on the plateform after 2015. The current usage metrics is available 48-96 hours after online publication and is updated daily on week days.
Initial download of the metrics may take a while.