Fig. 5.
Download original image
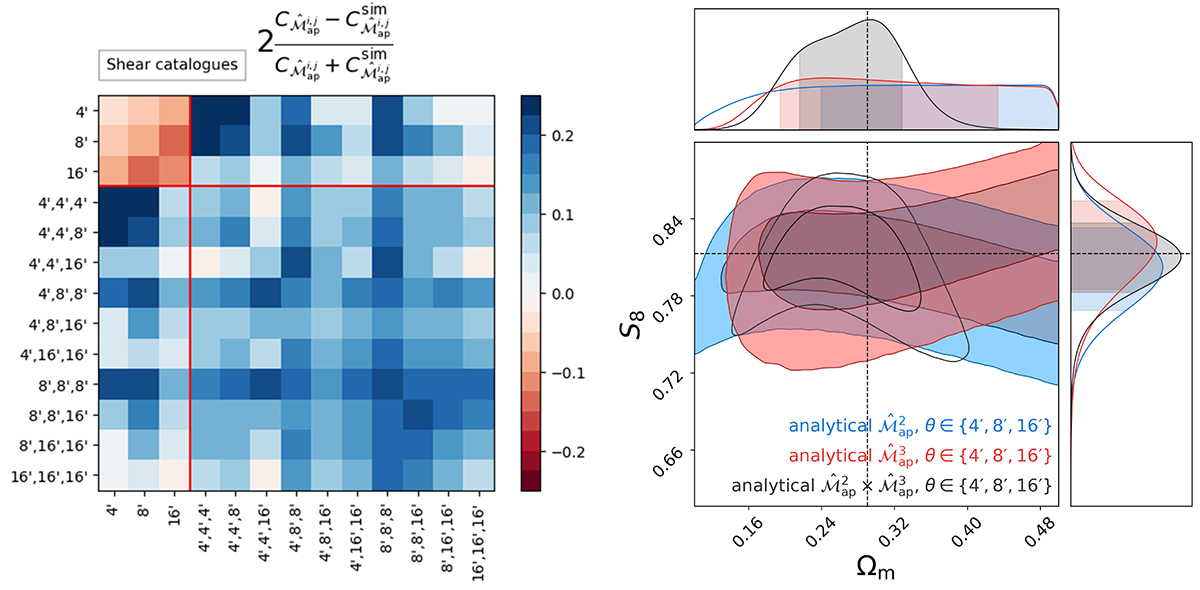
Left: fractional difference between the analytical and numerical joint covariance matrix of the second- and third-order aperture mass statistics. The red lines divide the parts of the joint covariance matrix. The 3 × 3 matrix at the top left is the covariance matrix of ![]() calculated in Linke et al. (2024). The 10 × 10 matrix at the bottom right is the covariance matrix of
calculated in Linke et al. (2024). The 10 × 10 matrix at the bottom right is the covariance matrix of ![]() from L+23. The non-square matrices at the top right and bottom left are the cross-covariance derived in this paper. Right: analytical S8–Ωm contours from the second- and third-order aperture mass statistics, shown separately and in combination.
from L+23. The non-square matrices at the top right and bottom left are the cross-covariance derived in this paper. Right: analytical S8–Ωm contours from the second- and third-order aperture mass statistics, shown separately and in combination.
Current usage metrics show cumulative count of Article Views (full-text article views including HTML views, PDF and ePub downloads, according to the available data) and Abstracts Views on Vision4Press platform.
Data correspond to usage on the plateform after 2015. The current usage metrics is available 48-96 hours after online publication and is updated daily on week days.
Initial download of the metrics may take a while.