| Issue |
A&A
Volume 702, October 2025
|
|
|---|---|---|
| Article Number | A263 | |
| Number of page(s) | 8 | |
| Section | Stellar atmospheres | |
| DOI | https://doi.org/10.1051/0004-6361/202554566 | |
| Published online | 28 October 2025 | |
Pre-outburst spectroscopic phenomena of RS Oph and active state of T CrB
Spectroscopic phenomena of RS Oph and T CrB
1
Astronomical Observatory of Padova, Asiago Section, Osservatorio Astrofisico,
36012
Asiago (Vi),
Italy
2
Institute of Nature and Environmental Science, University of Hyogo, Gakuen-nishi-machi,
8-2-1 Nishi-ku,
Kobe
651-2197,
Japan
★ Corresponding author: This email address is being protected from spambots. You need JavaScript enabled to view it.
Received:
17
March
2025
Accepted:
24
June
2025
Abstract
Context. RS Oph and T CrB are well-known symbiotic recurrent novae. RS Oph experiences outbursts every 10–20 years, and T CrB roughly every 80 years. Their next outbursts are predicted to take place in several years.
Aims. We monitored spectral variations in these objects to investigate whether there was any prevenient spectroscopic outburst phenomena.
Methods. High- and low-resolution optical spectra were obtained at the Asiago Astrophysical Observatory.
Results. A flare-up of the emission line He II 4686 was observed in April 1994 in a spectrum of RS Oph. This was probably the first sign of the 2006 outburst, because similar but weaker flare-ups followed in October. 1998, August 2001, April 2003, May 2004, and July 2005, namely, with the same interval on a logarithmic scale (one flare-up expected in February 2005 was not observable at our observatory). These flare-ups were possibly related to the instability of the accretion disk. Other signs of impending outbursts are the strengthening of the absorption lines of an A-type star, which occurs about 950 ± 50 days before an outburst; this occurred in 2006, 2021, and probably in 1985. We detected deep absorption lines of A-type star in March 2024 (on JD2460392). We wished to determine whether these absorption lines again strengthened 950 days before the next outburst, the expected date of which is around JD2461342 (October–November 2026). This would mean the interval from the last outburst in 2021 would be only 5 years which would be the shortest in the history of RS Oph. A more precise forecast will be possible if we detect a flare-up of He II 4686 in March 2026 (JD2461116, which would be about 226 days before the expected outburst. The most recent active state of T CrB lasted from December 2014 to around November 2022. The emission line He II 4686 was prominent during the active state, but no flare-up was observed.
Key words: binaries: symbiotic / novae, cataclysmic variables / stars: individual: RS Oph / stars: individual: T CrB
© The Authors 2025
 Open Access article, published by EDP Sciences, under the terms of the Creative Commons Attribution License (https://creativecommons.org/licenses/by/4.0), which permits unrestricted use, distribution, and reproduction in any medium, provided the original work is properly cited.
This article is published in open access under the Subscribe to Open model. This email address is being protected from spambots. You need JavaScript enabled to view it. to support open access publication.
1 Introduction
RS Oph has experienced outbursts every 10 to 20 years: in 1898, 1933, 1958, 1967, 1985, 2006 and 2021 (e.g. Rosino 1987; Schaefer 2010; Mikolajewska & Shara 2017; Pandey et al. 2022). There was also a possible outburst in 1907 (Schaefer 2004) and 1945 (Oppenheimer & Mattei 1993). The spectral variation of this object has been monitored by our observatory (Barbon et al. 1968; Rosino & Iijima 1987; Iijima 2009). The spectral variation in the quiescent state has also been monitored.
RS Oph is often represented by binary system models consisting of an M 2 ~ 3 III and a mass-accreting white dwarf (e.g. Hachisu & Kato 2001; Brandi et at. 2009). However, the occasional appearance of absorption lines of a B- or an early A-type star on the spectrum in the quiescent state is not consistent with such models (Dobrzycka & Kenyon 1994; Dobrzycka et al. 1996): such lines include Cr I, Fe I, Ca I, Ti I, Mg I, and Si II, and we abbreviate them collectively as “AVab” following the notation from Iijima et al. (2019). Dobrzycka et al. (1996) proposed a binary model consisting of an M-type giant and a B-type shell star. However, a strong outburst is not expected in such a system. The origin of AVab is not yet understood, but the same absorption lines were observed in spectra of symbiotic stars, for example CH Cyg (Iijima et al. 2019). We measured equivalent widths of AVab and the emission line He II 4686 for the purpose of investigating the relation between their variation and the outbursts.
We also present a short report on the recent spectral variation of T CrB. Historical outbursts of T CrB were recorded in 1866 and 1946 (e.g. Payne-Gaposchkin 1964; Schaefer 2023).
The interval between the outbursts was about 80 years.
After a long quiescent state that began in 1946, T CrB was found to be in a new active state in 2015 (Munari et al. 2016), which lasted until 2022 (Munari 2023). Munari et al. (2016) called the state a “super-active” state, but a similar active state was also observed in the years preceding the 1946 outburst (Luna et al. 2020; Schaefer 2023). Several authors have investigated the relation between the active state and the impending outburst (Munari et al. 2016; Luna et al. 2020; Ilkiewicz et al. 2016; Zamanov et al. 2023; Schaefer 2023). We present the equivalent width of the emission line He II 4686 and the intensity ratio, I(He II 4686)/I(Hβ), from 2010 to 2023.
2 Observations
Low-resolution spectra of RS Oph were mainly obtained with a Boller and Chivens grating spectrograph which had been mounted on the 182 cm Copernicus telescope at the Mount Ekar station of the Astronomical Observatory of Padova until 1997. The spectrograph was transferred to the 122 cm Galileo telescope at the Asiago Astrophysical Observatory of the University of Padova in 1998. The spectral resolution was λ/∆λ ≅ 1000 with a 600 groove mm−1 grating. A part of the low-resolution spectra were obtained with a prismatic spectrograph Camera VI, which had been mounted on the Galileo telescope until 1997. The spectral resolution was λ/∆λ ≅ 1000 on Hβ. High-resolution spectra, λ/∆λ ≅ 15 000, were obtained with a Reosc Echelle spectrograph mounted on the Copernicus telescope. All the T CrB spectra reported in this article were obtained with the Boller and Chivens spectrograph. The spectra were reduced using the standard tasks of the NOAO IRAF1 package at the Asiago Astrophysical Observatory. The spectrophotometric calibrations were performed with spectra of standard stars obtained on the same nights of the observations: those were Kopff 27 or HR 7596 for RS Oph and BD+33° 2642 for T CrB. Journals of the observations are provided in Tables A.1 (RS Oph) and A.2 (T CrB).
3 Spectral variation
3.1 Absorption lines of A-type star (AVab) of RS Oph
Figures 1–3 show traces in the spectral ranges 4800–4930 Å, 5150–5280 Å, and 6310–6440 Å of selected spectra of RS Oph and HR 4963 (A1 IV). The top line in each figure are those of RS Oph on May 29, 2016, when the AVab were weak, namely a normal spectrum in the quiescent state. The AVab were extremely deep for the spectra obtained on March 25, 2019, shown as the middle line. Traces of HR 4963 are exhibited at the bottom of the figures as an example of a spectrum of an early A-type star. As indicated in the figures, the AVab in these spectral ranges were Cr I, Fe I, Ti I, Mg I, Ca I, and Si II. The lines of Fe II were absorption on the spectrum of the A-type star (HR 4963), while they were blended with prominent emission components in the RS Oph spectra.
We measured equivalent widths of Cr 14804.9, Ti 14848.2, Mg I 5172.7, Ca I 5188.7, Si II 6347.1, and Si II 6371.4 Å. These lines were rather free from the blending with nearby absorption lines of the M-type giant. The results are presented in Table A.3. Figures 4, 5 and 6 show the equivalent widths obtained in the years preceding the 2006 outburst. The abscissae are the days to the outburst peak: JD 2453779.3 (Narumi et al. 2006). The equivalent widths in the years preceding the outburst in 2021 are plotted in Figures 7, 8 and 9. The abscissae are days to the outburst peak: JD 2459436.6 (Pandey et al. 2022).
Most AVab strengthened about 1000 days before the outburst in 2006 (Figs. 4, 5 and 6) and about 900 days before the outburst in 2021 (Figs. 7, 8 and 9). Garcia (1986) obtained high-resolution spectra in the range 5174–5200 Å in May and July 1982. Deep AVab were clearly visible in the spectrum obtained on July 1, 1982, which was 932 days before the 1985 outburst (Morrison 1985). The AVab likely also strengthened 900–1000 days before the 1985 outburst. We adopted 950±50 days before the outbursts as the date of the strengthening of the AVab.
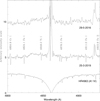 |
Fig. 1 Traces of selected spectra of RS Oph with no or weak AVab (top), and with deep AVab (middle), and selected spectra of HR 4963 (bottom). |
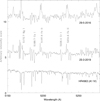 |
Fig. 2 Traces of selected spectra of RS Oph with no or weak AVab (top), and with deep AVab (middle), and selected spectra of HR 4963 (bottom). |
3.2 Emission line He II 4686 of RS Oph
3.2.1 Equivalent width
Equivalent widths of the emission line He II 4686 are presented in Table A.4. We first measured the equivalent widths about 7 years before the outbursts. The results are plotted in Fig. 10.
Flare-ups of He II 4686 were seen about 230, 620, 1050, and 1650 days before the outbursts. The intervals between days 230 and 620 and days 620 and 1650 are roughly the same on a logarithmic scale. The 1050 is halfway between 620 and 1650.
We searched for flare-ups of He II over a longer time span and found two, one on October 12, 1998 (2680 days before the 2006 outburst) and one of April 29, 1994 (4308 days before). The best fitted days to the outbursts of the flare-ups are given as
 (1)
(1)
where d(i) is days to the outbursts and “i” is an integer from 1 to 7. The errors in d(i) are about ±3%. The equivalent widths of He II 4686 on the longer time span are shown in Fig. 11. Flare-ups of i = 6 were not observed, because that for 2006 probably occurred in February 2005 during the seasonal gap of the monitoring and the telescope was taken offline for maintenance in August 2020. The flare-ups in the years preceding the 2021 outburst were relatively weak.
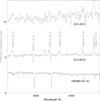 |
Fig. 3 Traces of selected spectra of RS Oph with no or weak AVab (top), and with deep AVab (middle), and selected spectra of HR 4963 (bottom). |
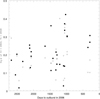 |
Fig. 4 Equivalent widths of Cr I 4804 (solid circle) and Ti I 4848 (asterisk) of RS Oph (in Å). |
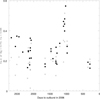 |
Fig. 5 Equivalent widths of Mg I 5172 (solid circle) and Ca I 5188 (asterisk) of RS Oph (in Å). |
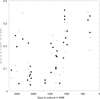 |
Fig. 6 Equivalent widths of Si II 6347 (solid circle) and Si II 6371 (asterisk) of RS Oph (in Å). |
3.2.2 Instability of accretion disk
Bollimpalli et al. (2018) investigated the instability of the accretion disk in the RS Oph system. They determined that dwarf-nova-like outbursts due to disk instabilities, cannot explain the outbursts of RS Oph. The intervals of the instabilities they found were in the range of several hundred to a few thousand days, and the amplitudes of the brightening were two magnitudes or less in the V band. These results disagree with those of the RS Oph outbursts, for which the intervals were 10 years or more and the amplitudes were about 7 mag. in the V or visual bands (e.g. Rosino 1987; Adamakis et al. 2011; Pandey et al. 2022).
The disk instabilities were more likely related to the flare-ups of He II 4686 than the outbursts, because the mass transferred from the M-type giant was kept in the accretion disk and then accreted to the white dwarf only when the instabilities occurred (Bollimpalli et al. 2018). One disagreement between the disk instability models and our observations is the variation in the interval of the He II 4686 flare-ups. The interval of disk instabilities depends on the mass transfer rate (Bollimpalli et al. 2018), and thus the interval is stable if the mass transfer rate is stable. However, the interval of the flare-ups, according to Eq. (1), changed from 1690 days to 144 days over 12 years. A corresponding variation in the mass transfer rate seems unlikely.
We believe that the interval of the instabilities may be more directly related to the mass of the disk than to the mass transfer rate. The mass transferred from the M-type giant during an interval of instabilities (mass gain of the disk) seems to be comparable to the mass accreted onto the white dwarf during an instability period (mass loss of the disk) in the Bollimpalli et al. (2018) models. This condition is necessary to repeat the disk instabilities with the same interval. On the other hand, if there were an imbalance between the mass gain and mass loss, the mass of the disk would vary according to the progress of the instabilities even when the mass transfer rate is stable. The intervals of disk instabilities and the flare-ups of He II 4686 might have varied following the variation in the mass of the disk. Detailed investigations of disk instabilities are awaited.
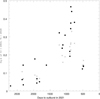 |
Fig. 7 Equivalent widths of Cr I 4804 (solid circle) and Ti I 4848 (asterisk) of RS Oph (in Å). |
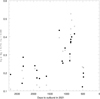 |
Fig. 8 Equivalent widths of Mg I 5172 (solid circle) and Ca I 5188 (asterisk) of RS Oph in (Å). |
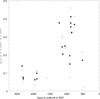 |
Fig. 9 Equivalent widths of Si II 6347 (solid circle) and Si II 6371 (asterisk) of RS Oph (in Å). |
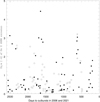 |
Fig. 10 Equivalent widths of He II 4686 (in −Å) of RS Oph in the years preceding the 2006 outburst (solid circle) and those related to the 2021 outburst (open circle). The two asterisks are data from Zamanov et al. (2005). |
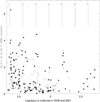 |
Fig. 11 Long-term variation in the equivalent width of the RS Oph He II 4686 line. Symbols have the same meaning as in Fig. 10. The abscissa is days to the outbursts on a logarithmic scale. Numbered vertical lines indicate expected dates of flare-ups according to Eq. (1); those with odd numbers are primary flare-ups. |
3.3 Recent spectral variation in RS Oph
The first high-resolution spectrum in the quiescent state after the 2021 outburst was obtained on September 25, 2023. This spectrum astonished us, because of which deep AVab were detected. The AVab became still deeper in March 2024 (JD2460392; Table A.3). Assuming this strengthening of the AVab indeed indicated that an outburst was going to occur in 950±50 days, the next outburst should take place in October–November 2026 (JD2461342), give or take a few months. This would mean a five-year interval between outbursts, which would be the shortest in the history of RS Oph.
If the next outburst does occur in October–November 2026, the flare-up 1622 days before the outburst (i = 3) of He II 4686 should have occurred around JD2459720 (May 2022), and we indeed detected a flare-up on JD2459742 (Table A.4). The flare-up of i = 5 was expected around JD2460737 (March 2025), and we observed it on JD2460755 (Table A.4). These results seem to support the forecast of an October–November 2026 outburst. A more precise forecast will be possible if we detect the i = 7 flare-up, predicted to occur about 226 days before the outburst, i.e., in March 2026 (JD2461116).
3.4 Active state of T CrB
Spectral variation of T CrB has been monitored in our observatory. The emission line He II 4686 was rarely detected in its quiescent state (Iijima 1990), but was prominent in the recent active state (Munari et al. 2016; Ilkiewicz et al. 2016).
Equivalent widths of He II 4686 and intensity ratios, I(He II 4686)/I(Hβ), in the years from 2010 to 2023 are presented in Table A.5 and plotted in Fig. 12. The effect of the interstellar extinction is corrected by E(B − V) = 0.07 (Nikolov 2022). As seen in Fig. 12, the active state began around JD2457000 (December 2014), and the emission line He II 4686 grew rapidly to its peak at JD2457499.5 (April 21, 2016) with an equivalent width of −18.4 Å, and then declined slowly. The intensity ratio, I(He II 4686)/I(Hβ), exhibited a similar variation. The active state seems to have ended around JD2459900 (November 2022).
The timescale of the active state is comparable to that of the series of He II 4868 flare-ups in RS Oph. The active state is likely a sign of an impending outburst, as suggested in previous works (Munari et al. 2016; Ilkiewicz et al. 2016; Luna et al. 2020; Schaefer 2023; Zamanov et al. 2023). The He II 4686 emission was prominent during the active state, but no flare-up was observed (Fig. 12). The accretion disk in the T CrB system may be somewhat different from that of RS Oph in terms of instability.
No line of AVab was detected in the T CrB spectrum during our monitoring.
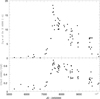 |
Fig. 12 Equivalent width of He II 4686 and intensity ratio He II 4686/Hβ of T CrB from 2010 to 2023. |
4 Summary
Spectral variations of two symbiotic recurrent novae, RS Oph and T CrB, are reported. The series of flare-ups of the He II 4686 emission line in the RS Oph spectrum (Sect. 3.2) is likely a sign of an impending outburst. The flare-ups were probably related to the disk instabilities investigated by Bollimpalli et al. (2018), but there is still a discrepancy between the model and the observed results in terms of the flare-up interval. Another sign of an impending outburst is the strengthening of absorption lines of an A-type star (AVab), which occurs 950±50 days before an outburst (Sect. 3.1). Based on these recent phenomena, we predict the next outburst of RS Oph will take place in October–November 2026, give or take a few months. This would make the interval from the last outburst only 5 years, which would be the shortest in the history of RS Oph.
The timescale of the active state of T CrB is comparable to that of the series of He II 4686 flare-ups in RS Oph (Sect. 3.4). The active state is likely a sign of an impending outburst as well. The emission line He II 4686 was prominent in the active state, but its flare-up was not observed. The accretion disk in the T CrB system may be somewhat different from that of RS Oph in terms of instability.
When investigating pre-outburst signals, our research was usually restricted to phenomena occurring within a few years preceding the outbursts. The outbursts of RS Oph and T CrB, however, had much longer run-ups. Further studies with longer time spans are required.
Data availability
Full appendix tables and the reduced spectra are available at the CDS via https://cdsarc.cds.unistra.fr/viz-bin/cat/J/A+A/702/A263
Acknowledgements
We are grateful to I. Hachisu, M. Kato, and H. Naito for the useful discussions and suggestions.
Appendix A Tables A.1–5
Spectroscopic observations of RS Oph (extract).
Spectroscopic observations of T CrB (extract).
Equivalent width of absorption lines AVab (in Å) of RS Oph (extract).
Equivalent widths of He II 4686 of RS Oph in a quiescent state (extract).
Equivalent widths of He II 4686 and intensity ratio He II/H/β of T CrB (extract).
References
- Adamakis, S., Eyres, S. P. S., Sarkar, A., & Walsh, R. W. 2011, MNRAS, 414, 2195 [NASA ADS] [CrossRef] [Google Scholar]
- Barbon, R., Mammano, A., & Rosino, L. 1968, in Non-Periodic Phenomena in Variable Stars, ed. L. Detre (Berlin: Springer), 257 [Google Scholar]
- Bollimpalli, D.A., Hameury, J.-M., & Lasota, J.-P. 2018, MNRAS, 481, 5422 [NASA ADS] [CrossRef] [Google Scholar]
- Brandi, E., Quiroga, C., Mikolajewska, J., Ferrer, O. E., & García, L.G. 2009, A&A, 497, 815 [NASA ADS] [CrossRef] [EDP Sciences] [Google Scholar]
- Dobrzycka, D., & Kenyon, S.J. 1994, AJ, 108, 2259 [NASA ADS] [CrossRef] [Google Scholar]
- Dobrzycka, D., Kenyon, S. J., Proga, D., Mikolajewska, J., & Wade, R. A. 1996, AJ, 111, 2090 [NASA ADS] [CrossRef] [Google Scholar]
- Garcia, M. R. 1986, AJ, 91, 1400 [Google Scholar]
- Hachisu, I., & Kato, M. 2001, ApJ, 558, 323 [NASA ADS] [CrossRef] [Google Scholar]
- Iijima, T. 1990, J. AAVSO, 19, 28 [Google Scholar]
- Iijima, T. 2009, A&A, 505, 287 [NASA ADS] [CrossRef] [EDP Sciences] [Google Scholar]
- Iijima, T., Naito. H., & Narusawa, S. 2019, A&A, 622, A45 [NASA ADS] [CrossRef] [EDP Sciences] [Google Scholar]
- Ilkiewicz, K., Mikolajewska, J., Stoyanov, K., Manousakis, A., & Miszalski, B. 2016, MNRAS, 462, 2695 [CrossRef] [Google Scholar]
- Luna, G. J. M., Sokoloski, J. L., Mukai, K., & Kuin, N. P. M. 2020, ApJ, 902, L14 [NASA ADS] [CrossRef] [Google Scholar]
- Mikolajewska, J., & Shara, M. M. 2017, ApJ 847, 99 [CrossRef] [Google Scholar]
- Morrison, W. 1985, IAU Circ., 4030 [Google Scholar]
- Munari, U. 2023, Res. Notes Am. Astron. Soc., 7, 145 [Google Scholar]
- Munari, U., Dallaporta, S., & Cherini, G. 2016, New Astron., 47, 7 [NASA ADS] [CrossRef] [Google Scholar]
- Narumi, H., Hirosawa, K., Kanai, K., et al. 2006, IAU Circ., 8671 [Google Scholar]
- Nikolov, Y. 2022, New Astron., 97, 101859 [NASA ADS] [CrossRef] [Google Scholar]
- Oppenheimer, B., & Mattei, J. 1993, Ame. Astron. Soc. Meeting Abst., 55.03 [Google Scholar]
- Pandey, R., Habtie, G. R., Bandyopadhyay, R., Ramkrishna, D., Teyssier, F., & Fló, J. G. 2022, MNRAS, 515, 4655 [NASA ADS] [CrossRef] [Google Scholar]
- Payne-Gaposchkin, C. 1964, The Galactic Novae (New York: Dover) [Google Scholar]
- Rosino, L. 1987, in RS Ophiuchi (1985) and the Reccurent Nova Phenomenon, ed. M. F. Bode (Boca Raton: CRC Press), 1 [Google Scholar]
- Rosino, L., & Iijima, T. 1987, in RS Ophiuchi (1985) and the Reccurent Nova Phenomenon, eds. M. F. Bode (Boca Raton: CRC Press), 27 [Google Scholar]
- Schaefer, B. E. 2004, IAU Circ., 8396, 2 [NASA ADS] [Google Scholar]
- Schaefer, B. E. 2010, ApJS, 187, 275 [NASA ADS] [CrossRef] [Google Scholar]
- Schaefer, B. E. 2023, MNRAS, 524, 3146 [NASA ADS] [CrossRef] [Google Scholar]
- Zamanov, R., Bode, M. F., Tomov, N. A., & Porter, J. M. 2005, MNRAS, 363, L26 [Google Scholar]
- Zamanov, R., Boeva, S., Latev, G. Y., et al. 2023, A&A, 680, L18 [NASA ADS] [CrossRef] [EDP Sciences] [Google Scholar]
- Zamanov, R., Marchev, V., Marti, J., & Latev, G. Y. 2024, Bulgarian J. Phys., 51, 263 [Google Scholar]
IRAF is distributed by NOAO for Research in Astronomy, Inc. under cooperative agreement with the National Science Foundation.
All Tables
Equivalent widths of He II 4686 and intensity ratio He II/H/β of T CrB (extract).
All Figures
|
Fig. 1 Traces of selected spectra of RS Oph with no or weak AVab (top), and with deep AVab (middle), and selected spectra of HR 4963 (bottom). |
| In the text | |
|
Fig. 2 Traces of selected spectra of RS Oph with no or weak AVab (top), and with deep AVab (middle), and selected spectra of HR 4963 (bottom). |
| In the text | |
|
Fig. 3 Traces of selected spectra of RS Oph with no or weak AVab (top), and with deep AVab (middle), and selected spectra of HR 4963 (bottom). |
| In the text | |
|
Fig. 4 Equivalent widths of Cr I 4804 (solid circle) and Ti I 4848 (asterisk) of RS Oph (in Å). |
| In the text | |
|
Fig. 5 Equivalent widths of Mg I 5172 (solid circle) and Ca I 5188 (asterisk) of RS Oph (in Å). |
| In the text | |
|
Fig. 6 Equivalent widths of Si II 6347 (solid circle) and Si II 6371 (asterisk) of RS Oph (in Å). |
| In the text | |
|
Fig. 7 Equivalent widths of Cr I 4804 (solid circle) and Ti I 4848 (asterisk) of RS Oph (in Å). |
| In the text | |
|
Fig. 8 Equivalent widths of Mg I 5172 (solid circle) and Ca I 5188 (asterisk) of RS Oph in (Å). |
| In the text | |
|
Fig. 9 Equivalent widths of Si II 6347 (solid circle) and Si II 6371 (asterisk) of RS Oph (in Å). |
| In the text | |
|
Fig. 10 Equivalent widths of He II 4686 (in −Å) of RS Oph in the years preceding the 2006 outburst (solid circle) and those related to the 2021 outburst (open circle). The two asterisks are data from Zamanov et al. (2005). |
| In the text | |
|
Fig. 11 Long-term variation in the equivalent width of the RS Oph He II 4686 line. Symbols have the same meaning as in Fig. 10. The abscissa is days to the outbursts on a logarithmic scale. Numbered vertical lines indicate expected dates of flare-ups according to Eq. (1); those with odd numbers are primary flare-ups. |
| In the text | |
|
Fig. 12 Equivalent width of He II 4686 and intensity ratio He II 4686/Hβ of T CrB from 2010 to 2023. |
| In the text | |
Current usage metrics show cumulative count of Article Views (full-text article views including HTML views, PDF and ePub downloads, according to the available data) and Abstracts Views on Vision4Press platform.
Data correspond to usage on the plateform after 2015. The current usage metrics is available 48-96 hours after online publication and is updated daily on week days.
Initial download of the metrics may take a while.