| Issue |
A&A
Volume 702, October 2025
|
|
|---|---|---|
| Article Number | A111 | |
| Number of page(s) | 15 | |
| Section | Stellar atmospheres | |
| DOI | https://doi.org/10.1051/0004-6361/202554902 | |
| Published online | 13 October 2025 | |
Rotational modulation and long-term evolution of the small-scale magnetic fields of M dwarfs observed with SPIRou
1
Leiden Observatory, Leiden University,
PO Box 9513,
2300
RA Leiden,
The Netherlands
2
Center for Astrophysics | Harvard & Smithsonian,
60 Garden Street,
Cambridge,
MA
02138,
USA
3
Univ. de Toulouse, CNRS, IRAP,
14 avenue Belin,
31400
Toulouse,
France
4
Institut Trottier de recherche sur les exoplanètes, Département de Physique, Université de Montréal,
Montréal,
Québec,
Canada
5
Univ. Grenoble Alpes, CNRS, IPAG,
38000
Grenoble,
France
6
ACRI-ST,
260 route du Pin Montard, BP 234,
06904
Sophia-Antipolis,
France
7
Departamento de Física, UFRN,
CP 1641,
59072-970
Natal,
RN,
Brazil
★ Corresponding author: This email address is being protected from spambots. You need JavaScript enabled to view it.
Received:
31
March
2025
Accepted:
5
August
2025
Abstract
Context. M dwarfs are known to host magnetic fields, impacting exoplanet studies and playing a key role in stellar and planetary formation and evolution. Observational constraints are essential to guide theories of dynamo processes believed to be at the origin of those fields, in particular for fully convective stars whose internal structure differs from that of partially convective stars. Observations reveal long-term evolution of the large-scale magnetic field reconstructed with Zeeman-Doppler imaging, and a diversity of their topologies. These large-scale magnetic fields, however, only account for a small amount of the unsigned magnetic flux at the stellar surface that can be probed by directly modeling the Zeeman broadening of spectral lines in unpolarized spectra.
Aims. We aim to investigate the long-term behavior of the average small-scale magnetic field of fully convective and partially convective M dwarfs with time, and assess our ability to detect rotational modulation and retrieve rotation periods from time series of field measurements derived from unpolarized spectra.
Methods. We performed fits of synthetic spectra computed with ZeeTurbo to near-infrared high-resolution spectra recorded with SPIRou between 2019 and 2024 in the context of the SLS and SPICE large programs. The analysis was performed on the spectra of two partially convective (AD Leo and DS Leo) and three fully convective (PM J18482+0741, CN Leo, and Barnard’s star) M dwarfs, along with EV Lac, whose mass is close to the fully convective limit. Our analysis provides measurements of the average small-scale magnetic field, which are compared to longitudinal magnetic field and temperature variation measurements (dTemp) obtained from the same data.
Results. We detected the rotation period in the small-scale magnetic field series for four of the 6 stars in our sample. We find that the average magnetic field can vary by up to 0.3 kG throughout the year (e.g., CN Leo), or of up to 1 kG across rotation phases (e.g., EV Lac). The rotation periods retrieved from longitudinal and small-scale magnetic fields are found to agree within error bars. The dTemp measurements are found to anti-correlate with small-scale magnetic field measurements for three stars (EV Lac, DS Leo, and Barnard’s star).
Conclusions. The results demonstrate our ability to measure rotation periods from high-resolution data through small-scale magnetic field measurements, provided that the inclination of the observed targets is sufficiently large. We observe long-term fluctuations of the average magnetic field that could indicate magnetic cycles in the parent dynamo processes. These long-term variations appear mainly uncorrelated with large-scale magnetic field variations probed through longitudinal field measurements. Large variations in the amplitude of the rotationally modulated signals, in particular, hint towards a change in the distribution of the surface inhomogeneities accessible to Zeeman broadening measurements.
Key words: techniques: spectroscopic / stars: low-mass / stars: magnetic field
© The Authors 2025
 Open Access article, published by EDP Sciences, under the terms of the Creative Commons Attribution License (https://creativecommons.org/licenses/by/4.0), which permits unrestricted use, distribution, and reproduction in any medium, provided the original work is properly cited.
This article is published in open access under the Subscribe to Open model. This email address is being protected from spambots. You need JavaScript enabled to view it. to support open access publication.
1 Introduction
M dwarfs have attracted increasing attention in recent years for their properties as planet hosts. The characterization of M dwarfs is, in particular, essential to establish reliable constraints on the detected planets (Bonfils et al. 2013; Dressing & Charbonneau 2015; Gaidos et al. 2016). M dwarfs are known to host magnetic fields (e.g., Saar & Linsky 1985; Johns-Krull & Valenti 1996; Shulyak et al. 2014; Kochukhov 2021; Reiners et al. 2022), routinely impairing exoplanet characterization and causing activity phenomena that lead to spurious signals in radial velocity curves (e.g., Dumusque et al. 2021; Bellotti et al. 2022). These fields play a crucial role in stellar formation and evolution (Donati & Landstreet 2009), and are responsible for a number of observable phenomena, such as momentum loss over the stellar lifetime (e.g., Skumanich 1972; Vidotto et al. 2014), which led to the development of gyrochronology (Barnes 2003), or surface inhomogeneities (spots, plages, and faculae).
M dwarfs are the most numerous stars in the solar vicinity (Reylé et al. 2021), with masses ranging from 0.08 to 0.57 M⊙ (Pecaut & Mamajek 2013). Stars with masses smaller than 0.35, M⊙ are predicted to be fully convective. In partially convective stars, with M>0.35 M⊙, the tachocline (the region at the interface between the inner radiative core and outer convective envelope, Chabrier & Baraffe 1997) has been proposed as a key ingredient in dynamo processes at the origin of magnetic fields. In fully convective stars, dynamo theories can no longer rely on the tachocline, and an alternative α2-dynamo mechanism is proposed to generate strong magnetic fields without the need for the tachocline (Chabrier & Küker 2006; Yadav et al. 2015).
In the last decade, the advent of new high-resolution near-infrared instruments, including spectrometers such as CARMENES (Quirrenbach et al. 2014) and spectropolarimeters such as CRIRES+ (Dorn et al. 2023) or SPIRou (Donati et al. 2020), along with the development of new spectral modeling codes, has provided new constraints on the atmospheric properties of a large number of Μ dwarfs (e.g., Rajpurohit et al. 2018; Passegger et al. 2019; Marfil et al. 2021; Sarmento et al. 2021; Cristofari et al. 2022b,a). The polarized data recorded with such instruments have led to numerous studies focusing on the large-scale magnetic field of such stars (e.g. Finociety et al. 2023; Donati et al. 2023a; Bellotti et al. 2024), while several other works have relied on unpolarized spectra to estimate the average surface magnetic field of low-mass and Sun-like stars by modeling the Zeeman broadening and intensification of well-selected spectral lines (Shulyak et al. 2017; Reiners et al. 2022; Cristofari et al. 2023a,b; Kochukhov et al. 2024). Those measurements open the door to complementary studies that aim to draw a complete picture of the magnetic fields in Μ dwarfs from large-scale and small-scale field measurements (e.g. Kochukhov & Lavail 2017; Donati et al. 2023a). Large surveys of magnetic Μ dwarfs have produced time series of spectra for hundreds of stars, providing the data necessary to investigate the link between rotation and magnetic fields. Magnetic activity is known to scale with Rossby number, defined as the ratio between the rotation period and the convective turnover time, and recent works have found that magnetic fields follow a similar trend for fully and partially convective stars (e.g. Reiners et al. 2022; Cristofari et al. 2023b).
In this paper we present for the first time a systematic investigation of the evolution of the average magnetic field and longitudinal field over periods of months or years for several magnetic Μ dwarfs observed with SPIRou. This work uses the long-term monitoring of six fully convective and partially convective targets (EV Lac, DS Leo, CN Leo, PM J18482+0741, AD Leo, and Barnard’s star) with SPIRou. We introduce the observations in Sect. 2 and the tools used for the analysis in Sect. 3. In Sect. 4, we present our results before discussing them in Sect. 6.
Parameters retrieved from the literature for the stars in our sample.
2 Observations and reduction
The analysis presented in this paper relies on observations recorded with the spectropolarimétre infrarouge, SPIRou, installed at the Canada-France-Hawaii Telescope. These observations were part of several key programs: the SPIRou Legacy Survey (SLS), a three-year program allocated 310 nights between 2019 and 2022; the SPIRou Legacy Survey - Consolidation and enhancement (SPICE) large program; and various PI programs (Run IDs 24AC25, 23AD98, 22BF10, 24AF17, 24BF13, and 23BF08). We focus on a sample of five strongly magnetic Μ dwarfs (EV Lac, AD Leo, DS Leo, CN Leo, and PM J18482+0741; see Table 1), to which we add one quiet star (Barnard’s star). Spectra were reduced with APERO version 0.7.291 (Cook et al. 2022). Wavelength calibration, blaze estimation from flat-field exposures, and telluric correction were performed by APERO.
The unpolarized spectral orders were normalized using a low-degree polynomial, corrected for the barycentric Earth radial velocity (BERV), and rebinned on a common wavelength grid using a cubic interpolation. In addition to the spectra recorded each night, we computed a median spectrum, referred to as the “template” in the rest of the paper, by taking the median of each pixel in the barycentric reference frame. For those templates, the signal-to-noise ratio (S/N) per 2 km s−1 pixel can reach up to 2000 in the H band.
Polarimetric data were also reduced with the LIBRE-ESPRIT package adapted to SPIRou data (Donati et al. 2020). The polarimetric products were used to calculate the mean Stokes I and V profiles with least squares deconvolution (LSD, Donati et al. 1997). The longitudinal field estimates (Bℓ) obtained with these tools were compared with those obtained from the polarimetric products of APERO and the publicly available code LSDpy1. The two datasets provide similar results, and we therefore rely on the extensively tested LIBRE-ESPRIT implementation, which leads to slightly smaller error bars.
3 Data analysis
3.1 Stellar spectra modeling
Our analysis follows the process presented in Cristofari et al. (2023a), which we briefly describe in this section.
We used a grid of synthetic spectra computed with ZeeTurbo (Cristofari et al. 2023a) from MARCS model atmospheres (Gustafsson et al. 2008). Our grid spans temperatures ranging from 2700 to 4000 K, log g from 3.5 to 5.5, and [M/H] from −0.75 to 0.75 dex. For each set of atmospheric parameters, spectra were computed for surface magnetic fields ranging from 0 to 10 kG in steps of 2 kG, assuming that the magnetic field is radial at all points in the photosphere. Every spectrum in the grid was computed assuming local thermodynamic equilibrium (LTE). We used the results of Wende et al. (2009, see Fig. 10 therein) to determine a microturbulent velocity-Teff relation, yielding  , with a = 4.4 × 10⁻⁷ km s−1K−1, b = −2.4020 × 10⁻³km s−1K−1 and c = 3.5191 km s−1K−1. The vmic considered in our grid then range from ~0.25 to 0.98 km s−1. We note that previous tests show that imposing vmic = 1 km s−1 for all spectra within the grid has a very small impact on the results of our current analysis.
We adopted the same convention as in Cristofari et al. (2023a,b) and modeled the stellar spectra with a linear combination of the synthetic spectra computed for various magnetic field strengths, so that  , with Si the spectrum for the magnetic field i kG and fi the filling factor associated with that component. Our fitting procedure ensures that
  . To obtain the best fit to the data, we used a Markov chain Monte Carlo (MCMC) approach with the log-likelihood described in Cristofari et al. (2023b), and derived the parameters from the posterior distributions.
Atmospheric parameters and small-scale magnetic field.
3.2 Atmospheric characterization
In the first step, we derived the atmospheric parameters and average magnetic fields for each star by applying our process to the templates (see Table 2). This analysis was performed with the same assumptions on v sin i as in Cristofari et al. (2023a), except for Barnard’s star, whose v sin i was set to 0 km s−1 (Cristofari et al. 2023b). The retrieved atmospheric properties are in excellent agreement with those derived in our previous study (Cristofari et al. 2023a), performed on earlier version of the templates. We note that we obtain log g ≈ 5.0 dex for PM J18482+0741 and CN Leo, larger than in Cristofari et al. (2023a), and closer to the values expected from radius and mass estimates (5.12 ± 0.13 dex and 5.25 ± 0.17 dex, respectively; see Table 1). These improvements can be attributed to our refined line list selection and improvements to the normalization functions. Surface gravity is known to be difficult to constrain for M dwarfs, and line selection significantly impacts the results. The error bars on reported atmospheric parameters were inflated to account for some of the systematics, following Cristofari et al. (2022b).
In the second step, we fixed the atmospheric parameters to those derived from the template and estimated 〈B〉 from the spectra recorded each night, obtaining a time series of magnetic field measurements for each star. For all stars but Barnard’s star, we modeled the spectra with a combination of magnetic models ranging from 0 to 10 kG in steps of 2kG. For Barnard’s star, only the 0 and 2 kG components were considered.
4 Temporal modulation of the small-scale and large-scale magnetic fields
4.1 Quasi-periodic Gaussian process fit to the data
Quasi-periodic Gaussian processes (GPs) have become popular to study the evolution of stellar activity and to extract rotation periods (see, e.g., Fouqué et al. 2023; Donati et al. 2023a,b). We investigated the temporal modulation of our data by using a GP regression with a kernel previously employed in Angus et al. (2018); Fouqué et al. (2023):
![Mathematical equation: \kappa(t_i, t_j)=\alpha^2\exp\left[-\frac{(t_i - t_j)^2}{2l^2}-\frac{1}{2\beta^2}\sin^2\left(\frac{\pi(t_i - t_j)^2}{P_{\rm rot}}\right)\right] + \sigma^2\delta_{ij}.](/articles/aa/full_html/2025/10/aa54902-25/aa54902-25-eq4.png) (1)
(1)
Here, α is the amplitude of the GP, β is a smoothing factor, l is the decay time, σ is the standard deviation of an added uncorrelated white noise, and Prot is the recurrence period, here taken to represent the rotation period of the star. This flexible model enables the modeling of complex structures but can be degenerate, resulting in overfitting (Angus et al. 2018). For each star, we therefore obtain a fit with wide priors (assuming little knowledge of the GP hyperparameters).
Our implementation2 is based on the George (Ambikasaran et al. 2015) Python package and a workflow loosely based on that of Martioli et al. (2022). Our tools explore the parameter space using a Markov chain Monte Carlo (MCMC) approach, relying on the emcee package (Mackey et al. 2008) to estimate the set of hyperparameters (see Equation (1)) and the mean value (μ) that lead to the highest likelihood described in Rasmussen & Williams (2006); Foreman-Mackey et al. (2017) and implemented in George.
For most targets, the minimum reduced χ2 ( ) of the GP fit is much lower than one. These likely reflect that the error bars computed for 〈B〉 attempt to account for some of the systematics associated with the measurements and do not reflect relative precision. Given that we investigated the relative variation of the measurements, we rescaled the error bars using the dispersion of the residuals to ensure that the minimum reduced
  is closer to unity. In the remainder of the paper, the errors listed for 〈B〉 correspond to these rescaled error bars.
To estimate the parameters that lead to the best fit to the data, we searched for the combination of hyperparameters that maximize the likelihood. To avoid bias from a single walker’s position, we considered the top 1% walkers with the highest likelihood and took the median of these walkers’ parameters. Our process was applied to 〈B〉 and Bl measurements. We also performed simultaneous GP fits on the series of 〈B〉 and Bl measurements, with the same rotation period for both GPs. Finally, we applied our process to dTemp measurements obtained following Artigau et al. (2024), attempting to capture temperature variations at the stellar surface by relying on changes in stellar line profiles throughout the observation campaign. For each star, we collected the dTemp measurements obtained with a reference temperature closest to those listed in Table 2 (i.e., 4000 K for DS Leo; 3500 K for AD Leo, EV Lac and Barnard’s star; and 3000K for PM J18482+0741 and CN Leo). The minimum reduced  of the best GP fit to the dTemp series measurements ranges from 2 to 94, with particularly large values for CN Leo and PM J18482+0741 (
 and
and  , respectively), likely indicating that the error bars are underestimated. For dT emp, we therefore rescaled the error bars to ensure that the minimum reduced χ2 is closer to 1 for the best fits. The results of the GP fits are presented in Tables A.1, A.2, A.3, A.4, A.5, and A.6.
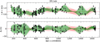 |
Fig. 1 Simultaneous fit of two Gaussian processes (GPs) to our small-scale and large-scale magnetic field measurements. The rotational velocity Prot is the same for both GPs. The pink shaded area shows the uncertainty of the GP fit. |
4.2 DS Leo (Gl410)
DS Leo is one of the most massive and least magnetic stars in our sample, with an average field of 0.79 ± 0.02 kG, around which a possible planetary system was recently detected using SPIRou data (Carmona et al. 2025). We detect a clear modulation of the magnetic field strength, with a detectable signal at 13.953 ± 0.088 d, consistent with previously reported rotation estimates (Donati et al. 2008). This period also agrees well with that obtained by applying our process to Bℓ measurements (14.001 ± 0.077 d).
We observe a variation in the amplitude of 〈B〉, with a minimum reached between July 2021 and early 2022 (see Fig. C.1, available on Zenodo). The amplitude of the signal varies by more than 0.3 kG, decreasing from ~0.9 kG in March 2021 to ~0.3 kG in July 2021. The amplitude in Bℓ measurements also decreases and then increases, with a minimum reached in early 2022, and a maximum around July 2021 (see Fig. D.1, available on Zenodo). The series of 〈B〉 and |Bℓ| appear uncorrelated, with a Pearson coefficient of 0.14. Gaussian process fits to the time series of filling factors show a clear rotational modulation of the 2 kG component, as well as of the nonmagnetic component. No clear modulation is found for the other filling factors, whose values are close to zero.
DS Leo was reported to display differential rotation (Hébrard et al. 2016), with rotation periods at the equator and the pole of 13.37 ± 0.86 d and 14.96 ± 1.25 d, respectively. Our period derived from small-scale magnetic field measurements lies between these values.
We performed a simultaneous fit of two GPs to the series of 〈B〉 and Bℓ measurements (see Fig. 1), yielding a rotation period of 13.980 ± 0.059 d, consistent with those derived above. The results of the GP fits are presented in Table A.1.
We applied our process to the dTemp measurements obtained for Gl 410 (see Fig. E.1, available on Zenodo). Our best GP fit to the data yields a well-constrained recurrence period Prot = 14.214 ± 0.106 d (see Table A.1), slightly larger than that estimated from 〈B〉 and Bℓ.
4.3 AD Leo
Applying our process to the 〈B〉 measurements for AD Leo does not provide clear constraints on the rotation period (see Fig. C.2, available on Zenodo). This result can be attributed to the star’s low inclination (i = 19.9 ± 1.3°, see Table 2): throughout the rotation phase, our process averages out the signal coming from the pole, resulting in very little modulation in the recorded spectra. Our 〈B〉 measurements remain relatively stable over months and years, with little variation in amplitude or mean observed. Only the first few and last two data points of our series hint at a long-term decrease of 〈B〉. The longitudinal field of AD Leo has been shown to vary (Lavail et al. 2018; Bellotti et al. 2023), with a significant increase in the rotationally modulated signal amplitude from mid-2019 to early 2020, and an increase of its mean from early 2020 to mid-2020 (see Fig. D.2, available on Zenodo).
Here again, we performed a simultaneous fit of two GPs to our 〈B〉 and Bℓ data. This process yields a rotation period of 2.230 ± 0.001 d, in perfect agreement with that retrieved from Bℓ (2.230 ± 0.001 d), suggesting that the constraint on Prot is primarily due to Bℓ. The results of the GP fits are presented in Table A.2.
We fit a GP on the dTemp measurements. Relying on wide uniform priors yields Prot = 1.81 ± 0.10 d. We note that two peaks are visible in the posterior distribution, with a secondary peak around the expected rotation period. To aid convergence, we repeated our process, fixing the smoothing parameter to 1.5 and setting a Gaussian prior centered on 2.3 with a 0.3 standard deviation on Prot (see Table A.2). With these additional constraints, we retrieve Prot = 2.227 ± 0.018 d (see Figs. E.2 and G.14, available on Zenodo). We note that a ~1.7 d period is also favored for the GP fit to 〈B〉 when relying on wide uniform priors or when setting the decay time to β = 0.4.
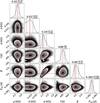 |
Fig. 2 Posterior distribution of the hyperparameters obtained for EV Lac. Red lines mark the median of the 1% of walkers with the highest likelihood. |
4.4 EV Lac (Gl 873)
We carried out our analysis on the data recorded for EV Lac, whose mass places it very close to the commonly adopted fully convective boundary (around 0.35 M⊙). Recent investigations have reported the presence of two spots at the stellar surface that lead to spurious signals in radial velocity measurements (Larue et al. in preparation), and a full Stokes spectropolarimetric investigation was recently carried out from the SPIRou data secured in September and October of 2023 (Donati et al. 2025). For this star, the atmospheric characterization yields atmospheric parameters in excellent agreement with Cristofari et al. (2023a). Our process provides well-constrained GP hyperparameters (see Fig. 2) and a rotation period of 4.362 ± 0.001 d, very close to the values reported by Morin et al. (2008, 4.3715 ± 0.0006 d) and Bellotti et al. (2024, 4.36 ± 0.01 d). This value is also in good agreement with the period retrieved by fitting the GP model to the longitudinal magnetic field measurements (Bℓ) obtained from polarimetric data, which yields a rotation period of 4.371 ± 0.003 d.
The observations for EV Lac span approximately three years, during which a clear fluctuation of GP amplitude is observed, with a minimum in 2019 and a maximum in 2021 (see Fig. 3). The amplitude of the GP decreases again in 2022, while the observations secured in September and October 2023 yield a lower mean small-scale field (~4.1, kG against ~4.5, kG). The amplitudes of Bℓ and 〈B〉 follow similar trends, with an increase in Bℓ amplitude for the second and fourth seasons, followed by a decrease in 2022. Comparing the series of 〈B〉 and |Bℓ|, we find a Pearson correlation coefficient of −0.41.
The daily sampling of the measurements allows us to observe significant variations in the distribution of the filling factors at different rotation phases (see Fig. 4). These distributions show a clear increase in the 8 kG component on June 22 and June 26-27, 2021 corresponding to days when the magnetic field is close to the average value obtained from the template, while the 10 kG component increases on June 23, 24, or 28 when 〈B〉 is larger than the value estimated from the template. To assess this behavior, we fit a GP to individual filling factors rather than to 〈B〉, restricting the priors around the expected rotation period. For EV Lac, clear rotation periods of 4.361 ± 0.001 d and 4.364 ± 0.003 d are detected for the 2 and 10 kG components, respectively. For the other components, convergence of the GP is more challenging, and multiple maxima appear in the rotation period histogram.
We repeated the analysis, simultaneously fitting two GPs to the 〈B〉 and Bℓ measurements, with a common rotation period (see Table A.3). The resulting rotation period (4.363 ± 0.001 d) remains closer to that estimated from 〈B〉 alone than that obtained from Bℓ. We note that our process applied to 〈B〉 and Bℓ converges to significantly different decay times (421 ± 80 d and 125 ± 16 d, respectively).
We also fit a GP to the dTemp measurements for EV Lac. Our best fit yields Prot = 4.361 ± 0.001 d, in excellent agreement with that derived from 〈B〉. We find that the dTemp obtained from the observations secured in September and October 2023 are on average larger than those obtained from the rest of the data (~4 K against −1 K, see Fig. E.3, available on Zenodo), where the small-scale magnetic field becomes weaker. We note a strong anticorrelation between 〈B〉 and dTemp measurements (see Sect. 5).
4.5 Barnard’s star (Gl 699)
We add Barnard’s star, a well-known quiet bright M dwarf with an average magnetic field estimated at 0.51 ± 0.08 kG (see Table 2), to our sample of active M dwarfs. Barnard’s star has been extensively studied and is relatively bright, leading to high-quality spectra throughout the monitoring campaign. This star therefore represents an ideal test case for assessing the performance of our method on a slow rotator.
From the best GP fit obtained, we derive a rotation period of 144 ± 6 d, consistent with the rotation estimated from Bℓ modulation (136 ± 13 d, Donati et al. 2023b) and that reported from dTemp measurements (Prot = 153 ± 3 d Artigau et al. 2024). These results demonstrate our ability to estimate rotational velocities from small-scale fields of low-activity stars, despite the relatively high uncertainties in magnetic field measurements and long rotation periods. We relied on the full set of data available for Barnard’s star and found that the convergence of the GP model on Bℓ was challenging. In particular, we find that with wide uniform priors, the GP converges towards a low decay time (15 ± 13 d), a Prot = 134 ± 50 d, and a smoothing factor of 3.0 ± 1.9. However, setting the priors so that the decay time is larger than 50 (i.e., ~ Prot/3) leads to convergence towards a decay time of 93 ± 40 d, a smoothing factor of 0.24 ± 0.15, and Prot = 189 ± 54 d. To aid convergence, we fixed the decay time to 100 d and the smoothing factor to 0.4, yielding Prot = 160 ± 20 d (see Table A.4). Simultaneously fitting two GPs with a common Prot to the 〈B〉 and Bℓ datasets (see Fig. 5) yields a rotation period of 139 ± 5 d. The series of (B) and |B1| measurements appear uncorrelated, with a Pearson correlation coefficient of 0.12.
Here again, we ran our process on the dTemp measurements secured for Barnard’s star. We obtained a well-constrained rotation period of Prot = 141 ± 12 d, which is in excellent agreement with those derived from 〈B〉 and Bℓ (see Fig. E.4, available on Zenodo).
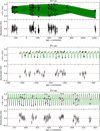 |
Fig. 3 Best-fit GP (green) obtained for our small-scale magnetic field measurements (black circles). The top panel shows the results obtained over the entire data set, while the middle and bottom panels are zoomed in on different observation periods. |
4.6 PM J18482+0741
PM J18482+0741 is the second-coolest target in our sample and a fully convective star, with a measured average magnetic field of 1.27 ± 0.14 kG. We first applied our process with uninformed priors on the rotation period. For this star, constraining Prot proved more challenging, and multiple peaks are visible in the posterior distribution. To aid convergence, we fixed the decay time and smoothing to typical values of 300 and 1.50, respectively. We also adopted a Gaussian prior centered on the expected rotation period for this star with a standard deviation of 0.6 d (see Table A.5). With this prior, our process yields a rotation period of 2.762 ± 0.009 d. This estimate is in agreement with that derived from Bℓ (2.761 ± 0.001 d) and by Díez Alonso et al. (2019, 2.76 ± 0.01 d).
The mean value of 〈B〉 varies throughout the monitoring, with a maximum in mid-2022 (~1.5 kG) and a minimum in mid-2021 (~1.2 kG). This 0.3 kG variation is not negligible compared to the typical error on individual measurements of 0.2 kG. Furthermore, we observe that the amplitude of the rotationally modulated signal decreases in 2022 compared to the other semesters. For PM J18482+0741, the Bℓ measurements do not show such long-term variations in amplitude or mean and appear uncorrelated with 〈B〉, with a Pearson correlation coefficient of 0.14. The rotational modulation does not clearly appear when fitting GP to the time series of the magnetic filling factors. Our simultaneous fit of two Gaussian processes to the 〈B〉 and Bℓ data yields a rotation period of 2.759 ± 0.001 d, in very good agreement with that derived from 〈B〉 and Bℓ (see Table A.5).
We carried out our process on the dTemp measurements obtained for PM J18482+074 (see Fig. E.5, available on Zenodo). Convergence relying on wide uniform priors proved challenging, with multiple peaks observed in the posterior distribution, impacting our ability to clearly constrain the rotation period. To aid convergence, we therefore fixed the smoothing factor to 1.50. A peak close to the highest likelihood is observed at about 2.7 d, consistent with the Prot derived from 〈B〉 and Bℓ, while several other peaks are observed in the posterior distribution (See Fig. G.17, available on Zenodo).
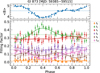 |
Fig. 4 Evolution of the filling factor distribution with respect to phase for EV Lac, for observations recorded between MJD 59385 and 59515. Solid lines show a fit of a sinusoidal with a first harmonic to the data, assuming the rotation period obtained from our GP fit (Prot = 4.362 d, see Sect. 4). For each filling factor, the dashed line marks the median of the series of points. Similar figures obtained for DS Leo, AD Leo, EV Lac, Barnard’s star, PMJ J18482+0741, and CN Leo are presented in Figs. B.1, B.2, B.3, B.4, and B.5. |
4.7 CN Leo (Gl406)
CN Leo is the coolest star in our sample and the one with the largest uncertainties on 〈B〉. These larger uncertainties can be attributed to the large molecular bands that affect the fits to the observed spectra. Using uninformed priors on the stellar rotation leads to poor convergence of the GP fit. To aid the fitting process, we fixed the decay time and smoothing factor and adopted a Gaussian prior centered on the expected rotation period (see Table A.6). However, these additional constraints are insufficient to clearly detect the rotation period.
We find that our magnetic field estimates decrease by ~0.3 kG from 2019 to 2022 (see Fig C.6, available on Zenodo). These results could indicate the presence of a long-term periodic fluctuation with a half-period of ~2-3 years. For this star, a clear rotational modulation is detected in the Bℓ measurements, but the average Bℓ values fluctuate by less than 0.2 kG and do not follow the variations observed in 〈B〉. For CN Leo, 〈B〉 and |Bℓ| appear uncorrelated, with a Pearson correlation coefficient of −0.33.
We repeated the analysis, simultaneously fitting two GPs to our 〈B〉 and Bℓ datasets. We find that the process then quickly converges, yielding a rotation period of 2.700 ± 0.004 d, in excellent agreement with that obtained from Bℓ (2.696 ± 0.006 d).
Additionally, we performed a GP fit on the dTemp measurements obtained for CN Leo, fixing the smoothing factor to 1.0 and setting a Gaussian prior on the rotation period to aid convergence (see Table A.6 and Fig. E.6, available on Zenodo). A clear peak at Prot = 3.003 d is observed in the posterior distribution, while a secondary peak at approximately 2.4 d is also observed, effectively impacting the lower uncertainties on this value. We note that these values are not in agreement with those derived from Bℓ measurements.
5 Comparison with dTemp
We compared our 〈B〉 estimates to dTemp measurements obtained following Artigau et al. (2024). We find a clear anticorrelation between 〈B〉 and dTemp for DS Leo, EV Lac, and Barnard’s star with Pearson correlation coefficients of −0.93, −0.86, and −0.71, respectively (see Figures 6, H.2, and H.3). No clear correlation is observed for AD Leo, CN Leo, and PM J18482+0741, with correlation coefficients of −0.45, 0.26, and −0.33, respectively. For CN Leo and PM J18482+0741, no clear rotational modulation is detected in the dTemp measurements, which could result from their lower temperatures and stronger molecular bands in their spectra. We note that Artigau et al. (2024) obtained a −0.92 correlation between 〈B〉 and dTemp for AU Mic, an M1V star exhibiting strong magnetic behavior.
We also note that while the convergence of our GP fit to dTemp for CN Leo and AD Leo is more challenging, a clear peak is observed at the expected rotation period in the posterior distribution. We performed linear fits to the dTemp-〈B〉 relations for Barnard’s star, EV Lac, and DS Leo, relying on orthogonal distance regression3, yielding slopes of-18.8 ± 0.8, −19.8 ± 0.5, and −60.4 ± 2.5 KkG−1, respectively. The intercepts of these fits are of 8.2 ± 0.3, 90.0 ± 2.3, and 53.0 ± 2.2 K for Barnard’s star, EV Lac, and DS Leo, respectively. These intercepts can be interpreted as the excess effective temperature one would observe if the stars were unspotted.
We summed the effective temperatures reported in Table 2 and the intercepts derived above to compute the effective temperature that the stars would have if unspotted (Tmax). Using the relation from Berdyugina (2005), we obtain contrast temperatures (between the photosphere and spots) of approximately 400, 520, and 720 K for Barnard’s star, EV Lac, and DS Leo, respectively. From Tmax and the temperature of the spot (Tspot), we derived a fraction of spot coverage (f ) for these three stars, assuming that T⋆ = (1 − f) Tmax + f Tspot, where T⋆ is the temperature reported in Table 2. Our results yield spot coverage fractions of approximately 2% for Barnard’s star, 19% for EV Lac, and 8% for DS Leo. These results are consistent with EV Lac being the most magnetic star and Barnard’s star being the least magnetic of the three, although the reported fractions should be treated with caution given the numerous sources of uncertainty (Herbst et al. 2021).
6 Discussion and conclusions
In this paper, we present the results of the first investigation of the small-scale magnetic field modulation in several stars. Our process relies on spectral models computed with Zee-Turbo (Cristofari et al. 2023a) and high-resolution near-infrared spectra recorded with SPIRou. Our sample is composed of three fully convective stars (CN Leo, PM J18482+0741, and Barnard’s star), two partially-convective star (AD Leo and DS Leo), and EV Lac, whose mass is close to the fully convective boundary.
Our small-scale field measurements reveal clear rotational modulation for EV Lac, DS Leo, and Barnard’s star, with little prior assumptions on the rotation period. Using more restrictive priors, we were able to obtain a rotation period for PM J18482+0741 but were unable to unambiguously constrain it for CN Leo and AD Leo. These results consolidate previous findings, for example on AU Mic (Donati et al. 2023a), demonstrating that the rotational period can be reliably constrained from 〈B〉, derived from unpolarized spectra, provided that the targets’ inclinations are sufficiently large and the S/N of the observations are high. Our sample included the low-activity Barnard’s star, for which we retrieved a clear rotation period. These results demonstrate our ability to apply this technique to numerous additional targets monitored over several years, including slow rotators.
For EV Lac, we find a clear rotational modulation in the 2 and 10 kG components, whereas for the other stars the total magnetic flux variations are distributed across multiple components or restricted to the 2 kG component. These peculiar results for EV Lac may arise from the presence of large spots at the stellar surface (Ikuta et al. 2023, Larue et al. in prep), leading to clear modulation of the higher magnetic field component. Subsequent studies will explore the impact of large spots and magnetic topology on the distribution of filling factors.
We carried out a joint fit of two Gaussian processes to the 〈B〉 and Bℓ measurements, with a single rotation period, decay time, and smoothing parameter. This approach has the potential to reduce the error bars on Prot estimates, as the process can leverage additional information. This approach leads to rapid and unambiguous convergence for most stars. We note that for PM J18482+0741, CN Leo, and AD Leo, the Prot estimates derived with this approach are very close to those obtained from the Bi data set alone, with similar or larger error bars. This likely arises from the limited additional constraint provided by the 〈B〉 dataset, which yields sub-optimal fits. For the other stars, however, using both data sets provides additional constraints on modeling of small-scale and large-scale magnetic fields.
Our measurements also reveal long-term variations of the small-scale magnetic fields, with amplitudes of the rotationally modulated signal increasing by a factor of two (e.g. EV Lac and DS Leo) or average field strengths decreasing by up to 0.3 kG (CN Leo). These fluctuations can exceed the uncertainties computed on 〈B〉, and are therefore likely to impact precision measurements performed on spectra recorded at a given epoch or averaged over long periods of time.
We find no clear correlation between the time series of 〈B〉 and |Bℓ| measurements for any target in our sample. For DS Leo and EV Lac, variations in signal amplitudes appear both in the 〈B〉 and Bℓ measurements. Only for EV Lac and AD Leo do the signals appear moderately anticorrelated or correlated, respectively, with Pearson correlation coefficients of −0.41 and 0.39. For DS Leo, although 〈B〉 and |Bℓ| appear uncorrelated, we note that the amplitudes of both rotationally modulated time series vary. These variations appear asynchronous, which could indicate a different relationship between the large-scale and small-scale magnetic fields for this star compared to EV Lac.
We compared our obtained small-scale magnetic field measurements to dTemp measurements obtained from the same SPIRou spectra. No clear correlation between the two sets of measurements was observed for AD Leo, which is viewed poleon, nor for Gl 406 and PM J18482+0741, for which no clear rotational modulation is found in the time series of dTemp measurements. The comparison revealed clear anti-correlations between the two series of measurements for EV Lac, DS Leo, and Barnard’s star, with Pearson correlation coefficients below −0.8. The anti-correlation between 〈B〉 and dTemp likely indicates that strong magnetic fields can give rise to dark spots at the stellar surface. Comparing 〈B〉 and dTemp for the three stars for which clear anticorrelations are observed, we note that dTemp values vary more rapidly with 〈B〉 for the M1 star (DS Leo), than for the late-type M dwarfs. This observation is further supported by the rapid variation of dTemp with 〈B〉 reported by Artigau et al. (2024) for the M1 star AU Mic. This phenomenon may be a consequence of the variation in spot coverage, whose impact is more significant in earlier M dwarfs owing to contrast. For EV Lac, we observe a significant decrease in the average small-scale magnetic field in September and October 2023. This change is accompanied by an increase in the average dTemp measurements, suggesting that the lower field intensity drives a decrease in cool magnetic regions at the stellar surface. Continued monitoring of EV Lac will allow us to establish whether these changes are indicative of magnetic cycles and if the small-scale magnetic field has reached a minimum.
From linear fits to the 〈B〉-dTemp trends, we derived decreasing slopes with increasing contrast, consistent with previous results suggesting that the contrast between the photosphere and spots increases with temperature (Berdyugina 2005), and suggesting that our measured small-scale magnetic fields arise from spots at the stellar surface. We further deduced the effective temperatures of the stars assuming that the obtained 〈B〉 are caused solely by spots. We relied on the relation proposed by Berdyugina (2005) to derive spot coverage estimates for Barnard’s star, EV Lac, and DS Leo. These results qualitatively agree with expectations, with the largest spot coverage (19%) for EV Lac, and the smallest (2%) for Barnard’s star. The amplitude of the dTemp signals suggests temporal fluctuations in spot coverage of up to 5%. An in-depth investigation of the relation between 〈B〉 and dTemp is required to unambiguously establish the origin of these anticorrelations.
The results presented here illustrate the benefits of smallscale magnetic fields measurements derived from near-infrared spectra collected over long observation campaigns. Future studies will provide additional measurements of small-scale magnetic fields and their temporal modulation. These measurements, combined with longitudinal field measurements and large-scale magnetic field topology reconstructions, will help to build a more complete picture of M dwarfs magnetism across the fully convective limit. Small-scale magnetic field measurements will also be valuable in mitigating their impact on radial velocity curves (e.g., Haywood et al. 2016, 2022), especially for slowly rotating, relatively inactive stars, which are favored targets in the search for habitable exoplanets.
 |
Fig. 6 Correlation between 〈B〉 and dTemp for EV Lac. The red line shows a linear with slope −19.8 ± 0.5 KkG−1 and intercept 90.0 ± 2.3 K. |
Acknowledgements
This project received funding from the European Research Council (ERC, grant 740651, NewWorlds) under the innovation research and innovation program H2020. S.B. acknowledges funding by the Dutch Research Council (NWO) under the project “Exo-space weather and contemporaneous signatures of star-planet interactions” (with project number OCENW.M.22.215 of the research programme “Open Competition Domain Science- M”). X.D. acknowledges funding from the French National Research Agency in the framework of the Investissements d’Avenir program (ANR-15-IDEX-02), through the funding of the “Origin of Life” project of the Grenoble-Alpes University.
Data availability
Full Tables A.1–A.18 are available at the CDS via https://cdsarc.cds.unistra.fr/viz-bin/cat/J/A+A/702/A111. Appendices C, D, E, F, and G are available on Zenodo (https://zenodo.org/records/16744873).
Appendix A Data tables
The results of the GP fits are presented in Tables A.1–A.6 (see Sec. 4). Tables A.7–A.12 present the 〈B〉 and dTemp data used in this paper, and Tables A.13–A.18 present the Bℓ data used in this paper (first entries, full table available at CDS).
GP hyper-parameters for DS Leo (Gl 410).
Measurements obtained each night for DS Leo (abstract Table).
Same as Table A.7 but for CN Leo.
Same as Table A.7 but for PMJ 18482+0741.
Same as Table A.7 but for Barnard’s star.
Bℓ measurements obtained each night for DS Leo (extract).
Same as Table A.7 but for EV Lac.
Same as Table A.7 but for AD Leo.
Same as Table A.7 but for CN Leo.
Same as Table A.7 but for PMJ 18482+0741.
Same as Table A.7 but for Barnard’s star.
Appendix B Filling factor distribution
Figures B.1, B.2, B.3, B.4, and B.5 present the phase folded modulation of the magnetic filling factors DS Leo, AD Leo, Barnard’s star, PMJ J18482+0741 and CN Leo, respectively.
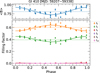 |
Fig. B.1 Same as Fig. 4 but for DS Leo, assuming Prot = 13.982 d, for observations recorded between MJD 59207 and 59338. |
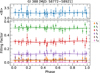 |
Fig. B.2 Same as Fig. 4 but for AD Leo, assuming Prot = 2.230 d, for observations recorded between MJD 58772 and 58921. |
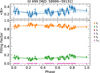 |
Fig. B.3 Same as Fig. 4 but for Barnard’s star, assuming Prot = 131.472 d, for observations recorded between MJD 58999 and 59131. |
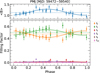 |
Fig. B.4 Same as Fig. 4 but for PMJ J18482+0741, assuming Prot = 2.760 d, for observations recorded between MJD 59472 and 59540. |
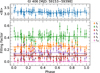 |
Fig. B.5 Same as Fig. 4 but for CN Leo, assuming Prot = 2.696 d, for observations recorded between MJD 59153 and 59398. |
References
- Ambikasaran, S., Foreman-Mackey, D., Greengard, L., Hogg, D. W., & O’Neil, M. 2015, IEEE Trans. Pattern Anal. Mach. Intell., 38, 252 [Google Scholar]
- Angus, R., Morton, T., Aigrain, S., Foreman-Mackey, D., & Rajpaul, V. 2018, MNRAS, 474, 2094 [Google Scholar]
- Artigau, É., Cadieux, C., Cook, N. J., et al. 2024, AJ, 168, 252 [Google Scholar]
- Barnes, S. A. 2003, ApJ, 586, 464 [Google Scholar]
- Bellotti, S., Petit, P., Morin, J., et al. 2022, A&A, 657, A107 [NASA ADS] [CrossRef] [EDP Sciences] [Google Scholar]
- Bellotti, S., Morin, J., Lehmann, L. T., et al. 2023, A&A, 676, A56 [NASA ADS] [CrossRef] [EDP Sciences] [Google Scholar]
- Bellotti, S., Morin, J., Lehmann, L. T., et al. 2024, A&A, 686, A66 [NASA ADS] [CrossRef] [EDP Sciences] [Google Scholar]
- Berdyugina, S. V. 2005, Liv. Rev. Sol. Phys., 2, 8 [Google Scholar]
- Bonfils, X., Lo Curto, G., Correia, A. C. M., et al. 2013, A&A, 556, A110 [NASA ADS] [CrossRef] [EDP Sciences] [Google Scholar]
- Carmona, A., Delfosse, X., Ould-Elhkim, M., et al. 2025, A&A, 700, A222 [NASA ADS] [CrossRef] [EDP Sciences] [Google Scholar]
- Chabrier, G., & Baraffe, I. 1997, A&A, 327, 1039 [NASA ADS] [Google Scholar]
- Chabrier, G., & Küker, M. 2006, A&A, 446, 1027 [NASA ADS] [CrossRef] [EDP Sciences] [Google Scholar]
- Cook, N. J., Artigau, É., Doyon, R., et al. 2022, PASP, 134, 114509 [NASA ADS] [CrossRef] [Google Scholar]
- Cristofari, P. I., Donati, J. F., Masseron, T., et al. 2022a, MNRAS, 516, 3802 [NASA ADS] [CrossRef] [Google Scholar]
- Cristofari, P. I., Donati, J. F., Masseron, T., et al. 2022b, MNRAS, 511, 1893 [NASA ADS] [CrossRef] [Google Scholar]
- Cristofari, P. I., Donati, J.-F., Folsom, C. P., et al. 2023a, MNRAS, 522, 1342 [NASA ADS] [CrossRef] [Google Scholar]
- Cristofari, P. I., Donati, J. F., Moutou, C., et al. 2023b, MNRAS, 526, 5648 [NASA ADS] [CrossRef] [Google Scholar]
- Díez Alonso, E., Caballero, J. A., Montes, D., et al. 2019, A&A, 621, A126 [NASA ADS] [CrossRef] [EDP Sciences] [Google Scholar]
- Donati, J. F., & Landstreet, J. D. 2009, ARA&A, 47, 333 [Google Scholar]
- Donati, J. F., Semel, M., Carter, B. D., Rees, D. E., & Collier Cameron, A. 1997, MNRAS, 291, 658 [Google Scholar]
- Donati, J. F., Morin, J., Petit, P., et al. 2008, MNRAS, 390, 545 [Google Scholar]
- Donati, J. F., Kouach, D., Moutou, C., et al. 2020, MNRAS, 498, 5684 [Google Scholar]
- Donati, J. F., Cristofari, P. I., Finociety, B., et al. 2023a, MNRAS, 525, 455 [NASA ADS] [CrossRef] [Google Scholar]
- Donati, J. F., Lehmann, L. T., Cristofari, P. I., et al. 2023b, MNRAS, 525, 2015 [CrossRef] [Google Scholar]
- Donati, J. F., Cristofari, P. I., Klein, B., Finociety, B., & Moutou, C. 2025, A&A, 700, A122 [NASA ADS] [CrossRef] [EDP Sciences] [Google Scholar]
- Dorn, R. J., Bristow, P., Smoker, J. V., et al. 2023, A&A, 671, A24 [NASA ADS] [CrossRef] [EDP Sciences] [Google Scholar]
- Dressing, C. D., & Charbonneau, D. 2015, ApJ, 807, 45 [Google Scholar]
- Dumusque, X., Cretignier, M., Sosnowska, D., et al. 2021, A&A, 648, A103 [NASA ADS] [CrossRef] [EDP Sciences] [Google Scholar]
- Finociety, B., Donati, J. F., Cristofari, P. I., et al. 2023, MNRAS, 526, 4627 [NASA ADS] [CrossRef] [Google Scholar]
- Foreman-Mackey, D., Agol, E., Ambikasaran, S., & Angus, R. 2017, AJ, 154, 220 [Google Scholar]
- Fouqué, P., Martioli, E., Donati, J. F., et al. 2023, A&A, 672, A52 [NASA ADS] [CrossRef] [EDP Sciences] [Google Scholar]
- Gaidos, E., Mann, A. W., Kraus, A. L., & Ireland, M. 2016, MNRAS, 457, 2877 [Google Scholar]
- Gustafsson, B., Edvardsson, B., Eriksson, K., et al. 2008, A&A, 486, 951 [NASA ADS] [CrossRef] [EDP Sciences] [Google Scholar]
- Haywood, R. D., Collier Cameron, A., Unruh, Y. C., et al. 2016, MNRAS, 457, 3637 [Google Scholar]
- Haywood, R. D., Milbourne, T. W., Saar, S. H., et al. 2022, ApJ, 935, 6 [NASA ADS] [CrossRef] [Google Scholar]
- Hébrard, É. M., Donati, J. F., Delfosse, X., et al. 2016, MNRAS, 461, 1465 [CrossRef] [Google Scholar]
- Herbst, K., Papaioannou, A., Airapetian, V. S., & Atri, D. 2021, ApJ, 907, 89 [NASA ADS] [CrossRef] [Google Scholar]
- Ikuta, K., Namekata, K., Notsu, Y., et al. 2023, ApJ, 948, 64 [Google Scholar]
- Johns-Krull, C. M., & Valenti, J. A. 1996, ApJ, 459, L95 [NASA ADS] [Google Scholar]
- Kochukhov, O. 2021, A&A Rev., 29, 1 [NASA ADS] [CrossRef] [Google Scholar]
- Kochukhov, O., & Lavail, A. 2017, ApJ, 835, L4 [Google Scholar]
- Kochukhov, O., Amarsi, A. M., Lavail, A., et al. 2024, A&A, 689, A36 [NASA ADS] [CrossRef] [EDP Sciences] [Google Scholar]
- Lavail, A., Kochukhov, O., & Wade, G. A. 2018, MNRAS, 479, 4836 [NASA ADS] [CrossRef] [Google Scholar]
- Mackey, A. D., Broby Nielsen, P., Ferguson, A. M. N., & Richardson, J. C. 2008, ApJ, 681, L17 [NASA ADS] [CrossRef] [Google Scholar]
- Marfil, E., Tabernero, H. M., Montes, D., et al. 2021, A&A, 656, A162 [NASA ADS] [CrossRef] [EDP Sciences] [Google Scholar]
- Martioli, E., Hébrard, G., Fouqué, P., et al. 2022, A&A, 660, A86 [NASA ADS] [CrossRef] [EDP Sciences] [Google Scholar]
- Morin, J., Donati, J. F., Petit, P., et al. 2008, MNRAS, 390, 567 [Google Scholar]
- Passegger, V. M., Schweitzer, A., Shulyak, D., et al. 2019, A&A, 627, A161 [NASA ADS] [CrossRef] [EDP Sciences] [Google Scholar]
- Pecaut, M. J., & Mamajek, E. E. 2013, ApJS, 208, 9 [Google Scholar]
- Quirrenbach, A., Amado, P. J., Caballero, J. A., et al. 2014, SPIE Conf. Ser., 9147, 91471F [Google Scholar]
- Rajpurohit, A. S., Allard, F., Rajpurohit, S., et al. 2018, A&A, 620, A180 [NASA ADS] [CrossRef] [EDP Sciences] [Google Scholar]
- Rasmussen, C. E., & Williams, C. K. I. 2006, Gaussian Processes for Machine Learning (Cambridge: MIT Press) [Google Scholar]
- Reiners, A., Zechmeister, M., Caballero, J. A., et al. 2018, A&A, 612, A49 [NASA ADS] [CrossRef] [EDP Sciences] [Google Scholar]
- Reiners, A., Shulyak, D., Käpylä, P. J., et al. 2022, A&A, 662, A41 [NASA ADS] [CrossRef] [EDP Sciences] [Google Scholar]
- Reylé, C., Jardine, K., Fouqué, P., et al. 2021, A&A, 650, A201 [Google Scholar]
- Saar, S. H., & Linsky, J. L. 1985, ApJ, 299, L47 [Google Scholar]
- Sarmento, P., Rojas-Ayala, B., Delgado Mena, E., & Blanco-Cuaresma, S. 2021, A&A, 649, A147 [NASA ADS] [CrossRef] [EDP Sciences] [Google Scholar]
- Shulyak, D., Reiners, A., Seemann, U., Kochukhov, O., & Piskunov, N. 2014, A&A, 563, A35 [NASA ADS] [CrossRef] [EDP Sciences] [Google Scholar]
- Shulyak, D., Reiners, A., Engeln, A., et al. 2017, Nat. Astron., 1, 0184 [NASA ADS] [CrossRef] [Google Scholar]
- Skumanich, A. 1972, ApJ, 171, 565 [Google Scholar]
- Vidotto, A. A., Gregory, S. G., Jardine, M., et al. 2014, MNRAS, 441, 2361 [Google Scholar]
- Wende, S., Reiners, A., & Ludwig, H. G. 2009, A&A, 508, 1429 [NASA ADS] [CrossRef] [EDP Sciences] [Google Scholar]
- Wright, N. J., Newton, E. R., Williams, P. K. G., Drake, J. J., & Yadav, R. K. 2018, MNRAS, 479, 2351 [Google Scholar]
- Yadav, R. K., Christensen, U. R., Morin, J., et al. 2015, ApJ, 813, L31 [Google Scholar]
Implemented in Scipy.
All Tables
All Figures
|
Fig. 1 Simultaneous fit of two Gaussian processes (GPs) to our small-scale and large-scale magnetic field measurements. The rotational velocity Prot is the same for both GPs. The pink shaded area shows the uncertainty of the GP fit. |
| In the text | |
|
Fig. 2 Posterior distribution of the hyperparameters obtained for EV Lac. Red lines mark the median of the 1% of walkers with the highest likelihood. |
| In the text | |
|
Fig. 3 Best-fit GP (green) obtained for our small-scale magnetic field measurements (black circles). The top panel shows the results obtained over the entire data set, while the middle and bottom panels are zoomed in on different observation periods. |
| In the text | |
|
Fig. 4 Evolution of the filling factor distribution with respect to phase for EV Lac, for observations recorded between MJD 59385 and 59515. Solid lines show a fit of a sinusoidal with a first harmonic to the data, assuming the rotation period obtained from our GP fit (Prot = 4.362 d, see Sect. 4). For each filling factor, the dashed line marks the median of the series of points. Similar figures obtained for DS Leo, AD Leo, EV Lac, Barnard’s star, PMJ J18482+0741, and CN Leo are presented in Figs. B.1, B.2, B.3, B.4, and B.5. |
| In the text | |
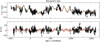 |
Fig. 5 Same as Fig. 1 but for Barnard's star. |
| In the text | |
|
Fig. 6 Correlation between 〈B〉 and dTemp for EV Lac. The red line shows a linear with slope −19.8 ± 0.5 KkG−1 and intercept 90.0 ± 2.3 K. |
| In the text | |
|
Fig. B.1 Same as Fig. 4 but for DS Leo, assuming Prot = 13.982 d, for observations recorded between MJD 59207 and 59338. |
| In the text | |
|
Fig. B.2 Same as Fig. 4 but for AD Leo, assuming Prot = 2.230 d, for observations recorded between MJD 58772 and 58921. |
| In the text | |
|
Fig. B.3 Same as Fig. 4 but for Barnard’s star, assuming Prot = 131.472 d, for observations recorded between MJD 58999 and 59131. |
| In the text | |
|
Fig. B.4 Same as Fig. 4 but for PMJ J18482+0741, assuming Prot = 2.760 d, for observations recorded between MJD 59472 and 59540. |
| In the text | |
|
Fig. B.5 Same as Fig. 4 but for CN Leo, assuming Prot = 2.696 d, for observations recorded between MJD 59153 and 59398. |
| In the text | |
Current usage metrics show cumulative count of Article Views (full-text article views including HTML views, PDF and ePub downloads, according to the available data) and Abstracts Views on Vision4Press platform.
Data correspond to usage on the plateform after 2015. The current usage metrics is available 48-96 hours after online publication and is updated daily on week days.
Initial download of the metrics may take a while.