Fig. 5.
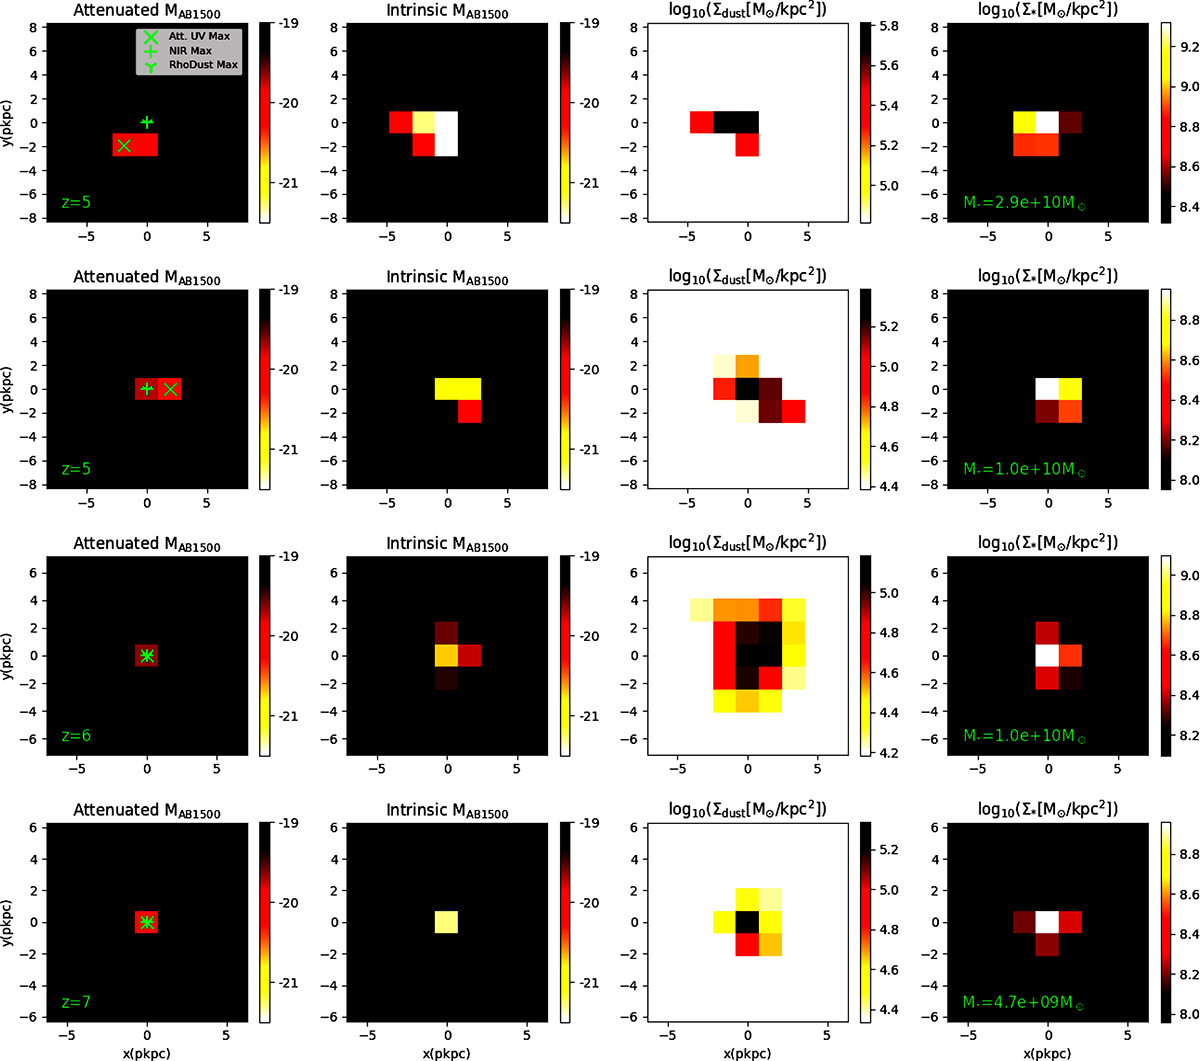
Download original image
From left to right: Restframe-UV absolute MAB1600 magnitudes, attenuated and intrinsic (unattenuated), dust column density, and projected stellar density maps of a sample of four CoDa III galaxies with dark matter halo masses MDM = 5 × 10¹¹ − 1012 M⊙ at z = 5–7. In the left panel, for each galaxy, symbols mark the positions of maximum attenuated UV flux (green ‘x’), maximum NIR flux – approximated by the maximum projected stellar density (green ‘+’) – and maximum dust column density (green ‘Y’). For the two leftmost plot columns, the colour indicates the absolute magnitude (attenuated or intrinsic) of each cell. The dust column density and projected stellar density are given in log10(M⊙/pkpc2).
Current usage metrics show cumulative count of Article Views (full-text article views including HTML views, PDF and ePub downloads, according to the available data) and Abstracts Views on Vision4Press platform.
Data correspond to usage on the plateform after 2015. The current usage metrics is available 48-96 hours after online publication and is updated daily on week days.
Initial download of the metrics may take a while.