| Issue |
A&A
Volume 703, November 2025
|
|
|---|---|---|
| Article Number | A98 | |
| Number of page(s) | 11 | |
| Section | Extragalactic astronomy | |
| DOI | https://doi.org/10.1051/0004-6361/202452098 | |
| Published online | 13 November 2025 | |
Dust-UV offsets in high-redshift galaxies in the Cosmic Dawn III simulation
1
Observatoire Astronomique de Strasbourg, Université de Strasbourg, CNRS UMR 7550, 11 rue de l’Université, 67000
Strasbourg, France
2
Institut d’Astrophysique de Paris, UMR 7095, CNRS, UPMC Univ. Paris VI, 98 bis boulevard Arago, 75014
Paris, France
3
Université Paris-Saclay, Université Paris Cité, CEA, CNRS, AIM, 91191
Gif-sur-Yvette, France
4
School of Physics and Astronomy, The University of Nottingham, University Park, Nottingham, NG7 2RD
UK
5
Univ. Lille, CNRS, Centrale Lille, UMR 9189 CRIStAL, F-59000
Lille, France
6
Université Paris-Saclay, CNRS, Institut d’Astrophysique Spatiale, 91405
Orsay, France
7
Leibniz-Institut für Astrophysik, An der Sternwarte 16, 14482
Potsdam, Germany
8
Department of Astronomy, Texas Center for Cosmology and Astroparticle Physics, Cosmic Frontier Center, The University of Texas at Austin, Austin, TX, 78712
USA
9
Department of Physics, California Polytechnic State University, San Luis Obispo, CA, 93407
USA
10
Department of Astrophysical Sciences, Princeton University, 4 Ivy Ln, Princeton, NJ, 08544
USA
11
Departamento de Física Teórica M-8, Universidad Autónoma de Madrid, Cantoblanco, 28049
Madrid, Spain
12
Centro de Investigación Avanzada en Física Fundamental (CIAFF), Universidad Autónoma de Madrid, 28049
Madrid, Spain
13
Astronomy Center, Department of Physics & Astronomy, Pevensey II Building, University of Sussex, Falmer, Brighton, BN1 9QH
United Kingdom
14
Chosun University, 375 Seosuk-dong, Dong-gu, Gwangjiu, 501-759
Korea
15
Lawrence Berkeley National Laboratory, CA, 94720-8139
USA
16
Berkeley Center for Cosmological Physics, UC Berkeley, CA, 94720
USA
⋆ Corresponding author: This email address is being protected from spambots. You need JavaScript enabled to view it.
.
Received:
3
September
2024
Accepted:
5
September
2025
Abstract
Recent observations reveal puzzling spatial offsets between the ALMA dust continuum from bright galaxies at z = 5–7 and their UV emission seen by HST and JWST (e.g. ALPINE and REBELS surveys). We investigated this using Cosmic Dawn (‘CoDa’) III, a state-of-the-art radiation-hydrodynamics simulation of fully coupled galaxy formation and re-ionisation, which includes a dynamical dust model. Dust-UV offsets are predicted for massive, UV-bright galaxies, up to ∼2 pkpc for the most massive haloes (MDM > 1011.5 M⊙, M* > 1010 M⊙, and MAB1600 < −21.5). Observed offsets are larger for ALPINE (4.4 < z < 5.9) than REBELS (z > 6.5), consistent with those in CoDa III, where higher-mass haloes appear at lower redshift. These offsets result primarily from severe dust extinction in galactic centres rather than from a misalignment in the dust- and stellar-mass distributions. At the CoDa III spatial resolution (1.65 pkpc at z = 6), dust and stellar components typically remain aligned. We predict that dust emission should therefore align well with stellar rest-frame Near Infra-Red, which is less affected by dust attenuation than the UV. This highlights the importance of dust in shaping galactic appearance. Our simulated dust masses for such bright galaxies agree with observational estimates, but to match the observed UV luminosity function, we reduced our dust attenuation. For SMC-like dust, the bright-end of the UV luminosity function at these redshifts is best fit, for example, with only 7.5% of the dust in CoDa III galaxies. Our massive galaxies thus reproduce the UV spectral slopes of ALPINE and REBELS galaxies, while preserving their dust-UV offsets, but exhibit dust masses lower than those suggested by observations.
Key words: methods: numerical / dust / extinction / galaxies: evolution / galaxies: formation / galaxies: high-redshift / dark ages / reionization / first stars
© The Authors 2025
 Open Access article, published by EDP Sciences, under the terms of the Creative Commons Attribution License (https://creativecommons.org/licenses/by/4.0), which permits unrestricted use, distribution, and reproduction in any medium, provided the original work is properly cited.
This article is published in open access under the Subscribe to Open model. This email address is being protected from spambots. You need JavaScript enabled to view it. to support open access publication.
1. Introduction
The formation and evolution of galaxies in the early universe, particularly during the epoch of re-ionisation (EoR), remains one of the most intriguing and challenging areas of study in modern astrophysics (Dayal & Ferrara 2018). This era, spanning roughly from redshift z ∼ 20 to z ∼ 5.3 (Bosman et al. 2022), is characterised by the birth of the first stars and galaxies, which ionise the neutral intergalactic medium (IGM) and fundamentally alter the cosmos (Barkana & Loeb 2001; Wise 2019; Ocvirk et al. 2016). However, our understanding of the physical processes governing galaxy formation during this period is still limited, largely due to observational challenges and the complex interplay of various astrophysical phenomena.
Recent advancements in observational capabilities have begun to shed light on the properties of high-redshift galaxies (z = 4 − 7). The Atacama Large Millimeter/submillimeter Array (ALMA) has been particularly instrumental in this regard, with large programmes such as ALPINE (ALMA Large Program to Investigate C+ at Early Times) providing unprecedented insights into the interstellar medium (ISM) and dust properties of galaxies at z ∼ 4 − 6 (Béthermin et al. 2020; Le Fèvre et al. 2020). These observations have revealed that a significant fraction of star formation at these redshifts is already obscured by dust, with some galaxies showing substantial far-infrared (FIR) emission (Fudamoto et al. 2020; Khusanova et al. 2021).
Building upon these results, subsequent surveys such as REBELS (Reionization Era Bright Emission Line Survey) have extended observations to higher redshifts (z > 6.5), using ALMA to detect dust continuum and [C II] line emission in UV-selected galaxies (Bouwens et al. 2022; Inami et al. 2022). These studies have uncovered unexpected features, notably significant spatial offsets between the dust continuum emission detected by ALMA and the UV starlight observed by HST and/or JWST (Bowler et al. 2022; Inami et al. 2022; Dayal et al. 2022). The ALPINE sample, for example, contains 54 galaxies detected in [CII] and far infrared by ALMA, UV emission in HST data, and optical emission in K-band UltraVISTA data. In this sample, about 30% of galaxies (17) feature offsets ranging from 3.5 to 4.5 pkpc (Killi et al. 2024). Such offsets challenge our current models of galaxy formation and evolution, suggesting a more complex structure of star formation and dust distribution in early galaxies than previously thought.
The presence of dust in high-redshift galaxies is itself a topic of considerable interest. Dust plays a crucial role in galaxy evolution, affecting the thermal balance of the ISM, catalysing the formation of molecular hydrogen, and absorbing UV photons to re-emit in the infrared (Draine 2003). The detection of substantial dust masses in some galaxies as early as z ∼ 7 − 8 raises questions about dust production and its properties as well as growth mechanisms in the early universe (Bakx et al. 2021; Sommovigo et al. 2022; Choban et al. 2024; Algera et al. 2024). Moreover, the fraction of obscured star formation appears to increase rapidly with stellar mass and may evolve significantly with redshift (Novak et al. 2017; Fudamoto et al. 2020; Zavala et al. 2021), impacting our understanding of the cosmic star formation history. Crucially, when trying to quantify obscured star formation density, observers need to rely on either i) using the Infra-red excess (IRX)-β diagram or ii) correcting for the attenuation measured in the visible or the UV. However, both methods can underestimate the amount of obscured star formation when UV and IR emissions are not co-spatial. For more details on these two points, see Ferrara et al. (2022), Sommovigo et al. (2020), 2022).
Theoretical efforts to understand these phenomena have motivated the inclusion of relevant physics in recent cosmological simulations. The goal of the Cosmic Dawn (CoDa) Simulation Project1 is to model galaxy formation during the EoR, employing fully coupled radiation-hydrodynamics simulations to self-consistently model the interplay between galaxy formation and cosmic re-ionisation (Ocvirk et al. 2016, 2020).
In parallel, other groups have made significant contributions to our theoretical understanding. The Renaissance (O’Shea et al. 2015) simulations, for instance, rely on high-resolution, zoom-in simulations of three regions of varying overdensity (‘void’, ‘normal’, and representative of a ‘rare peak’ in the dark matter density). Similarly, the FirstLight simulations (Ceverino et al. 2017) use several cosmological boxes run at different resolution levels with a zoom-in technique, and varying cosmological parameters, so as to unveil any bias introduced by box-size, resolution, or cosmology.
Other groups have focused on realising full box simulations as opposed to zoom-ins. In this framework, the SPHINX project Rosdahl et al. (2018), for instance, explored the role of binary stars in driving re-ionisation, while Gnedin and collaborators developed the Cosmic Re-ionization On Computers (CROC) project, providing insights into the re-ionisation process and the properties of high-redshift galaxies (Gnedin 2014, 2016). Others have explored the role of Active Galactic Nuclei (AGN) in re-ionising the Universe, with zoom-ins of a high-density proto-cluster region (Trebitsch et al. 2021), as well as full box simulations (Garaldi et al. 2022). Specific simulation suites also focused on high-z galaxy morphology in the UV and IR, such as Arata et al. (2019), Pallottini et al. (2022), Punyasheel et al. (2024). These theoretical efforts have highlighted the importance of properly modelling various physical processes, including stellar feedback, metal enrichment, and dust physics.
Hydrodynamical simulations can now incorporate the ab initio evolution of a dust component separately from the metal gas content (Bekki 2013; McKinnon et al. 2016; Li et al. 2019; Trebitsch et al. 2021; Lewis et al. 2023). Some simulations can follow various grain properties, such as size (Aoyama et al. 2017), chemical composition (Graziani et al. 2020; Choban et al. 2022), or both (Gjergo et al. 2018; Granato et al. 2021; Li et al. 2021). Models embedded in a porous multi-phase ISM allow us to directly account for observed local extinction curves (Dubois et al. 2024).
Building on these advances, Cosmic Dawn III (CoDa III), the latest iteration of the Cosmic Dawn Project, incorporates an early version of the Dubois et al. (2024) dust model, allowing to follow dust formation, distribution, and its effects on observable properties of galaxies as well as, for example, ionising escape fractions (Lewis et al. 2023). This improved modelling is crucial for understanding the complex relationship between star formation, dust, and the observed properties of high-redshift galaxies.
This paper is organised as follows: We first lay out our methodology in Sect. 2, describing the CoDa III simulation and the simple dust radiative transfer (RT) post-processing we performed, with particular emphasis on the dust mass recalibration we needed to account for. Results regarding dust-UV offsets in CoDa III galaxies are then presented in Sect. 3 and compared with the ALPINE and REBELS samples. Our conclusion follows in Sect. 4.
2. Methodology
2.1. The CoDa III simulation
Our study utilises the CoDa III simulation, a state-of-the-art, fully coupled radiation-hydrodynamics cosmological simulation of galaxy formation during the EoR. CoDa III is the latest iteration in the Cosmic Dawn Project, building upon the success of its predecessors (Ocvirk et al. 2016, 2020). The simulation was performed using the RAMSES-CUDATON code (Lewis et al. 2023), which couples the RAMSES code for N-body dynamics and hydrodynamics (Teyssier 2002) with the ATON radiative transfer module (Aubert & Teyssier 2008).
CoDa III simulates a co-moving volume of 94.4 cMpc per side, with a grid resolution of 81923 cells, providing a spatial resolution of 11.53 co-moving kpc. This corresponds to a physical cell size of 1.92, 1.65, and 1.44 kpc at redshifts 5, 6, and 7, respectively. The simulation follows the evolution of dark matter, gas, stars, and ionising radiation from redshift z = 150 to z = 4.6. For a comprehensive description of the simulation setup, including cosmological parameters, star formation and feedback prescriptions, and radiative transfer methods, we refer to Lewis et al. (2023). See also Sorce et al. (2016) and Sorce & Tempel (2018) for details on the generation of the initial conditions.
Part of what makes CoDa III a desirable setup for the present study is the fact that it produces a faithful description of the high-redshift re-ionising universe. Indeed, Lewis et al. (2022) show that the simulation is in excellent agreement with a number of observational diagnostics and forecasts of the intergalactic medium, namely:
-
The evolution of the neutral and ionised gas fractions with redshift, related to a non-monotonic cosmic ionising emissivity, as described in Ocvirk et al. (2021), and the use of the true speed of light rather than a reduced speed of light approximation, with a uniform or even spatially varying reduction factor (Deparis et al. 2019; Ocvirk et al. 2019);
-
The evolution of the ionising rate with redshift;
-
The electron-scattering optical depth seen by the cosmic microwave background; and
-
The evolution of the ionising photon mean free path up to z = 6 (Lewis et al. 2022).
Thanks to these studies, we know that CoDa III’s galaxy population re-ionises the universe in a faithful manner.
2.2. Dust model
The dust model implemented in CoDa III is the same as that included in the DUSTiER simulation (Lewis et al. 2023). It accounts for dust production, growth, and destruction processes. Dust is produced by supernovae and Asymptotic Giant Branch (AGB) stars, grows through the accretion of gas-phase metals in the ISM, and is destroyed by supernova shocks and thermal sputtering. Dust is accounted for in the ionising radiative transfer module of CoDa III through its opacity at 611 Å, as this is the only photon group we consider here. The dust model assumes a single grain size, and no chemical composition, which limits the ability to predict the shape of the extinction curve (useful to characterise exactly the extinction in the UV). For this reason, we assumed an extinction curve before running the simulation. CoDa III and DUSTiER employ a Small Magellanic Cloud (SMC) extinction curve2 from Draine & Li (2001)3, as explained in Lewis et al. (2022, 2023), yielding the following dust absorption coefficients, in m2/kg of dust (not mixture):
The dynamical dust model parameters (i.e. the dust condensation efficiency, maximum dust-to-metal ratio, and characteristic timescale for dust growth) were calibrated to reproduce observed dust masses in high-redshift galaxies by various studies (Mancini et al. 2015; Burgarella et al. 2020), including those measured by the REBELS survey (Sommovigo et al. 2022; Inami et al. 2022; Ferrara et al. 2022) and also reported, for example, in Dayal et al. (2022). For a detailed description of the dust model and its calibration, we refer to Lewis et al. (2022, 2023).
By incorporating this calibrated dust model, CoDa III aims to provide a simple representation of dust content and distribution in high-redshift galaxies, allowing us to investigate the relationship between dust emission and UV starlight as well as its impact on observable properties of the galaxies. However, as we explain in more detail in Sect. 2.6, using the raw dust masses from the simulation yields unrealistically high dust attenuations, which prompted us to multiply all dust masses by a factor of cdust = 0.075 in the rest of the study.
2.3. Galaxy identification and definition
To identify and define galaxies within our simulation, we employed a friends-of-friends (FOF) algorithm implemented in the Parallel Friends-of-Friends (PFOF) code (Roy et al. 2014). The choice of linking length is crucial in FOF algorithms, as it determines the extent to which particles are grouped together into a single structure. The linking length determines the density at the boundary of the FOF object; for a linking length of 0.2, the boundary has an overdensity of 81.62 (More et al. 2011). However, the resulting overdensity of the object depends also on the concentration, which varies with redshift. Thus, the same linking length leads to different overdensities at a given redshift, and the mean overdensity decreases for a given linking length at higher redshifts due to concentration evolution.
Initially, we experimented at high redshifts with a linking length of 0.2 times the mean inter-particle separation. This is a common choice in cosmological simulations at z = 0. However, we found that this led to overlinking, partly due to an artificial merging of distinct galactic structures. To address this issue, we checked shorter linking lengths and adopted a value of 0.15 times the mean inter-particle separation. This choice strikes a balance between identifying coherent galactic structures and avoiding spurious linking between separate galaxies. Moreover, at high redshifts, the FOF mass function is in good agreement with a spherical overdensity mass function which assumes a spherical overdensity of 200 (Watson et al. 2013). This confirms that 0.15 was an appropriate choice.
Using the FOF masses of the structures identified with this linking length, we then computed for each halo a characteristic radius RFoF using an overdensity of 200, which we use in the following analysis to identify the stellar particles residing in the given halo. This approach is consistent with the methodology used in the DUSTiER simulation (Lewis et al. 2023), although the latter used the RAMSES built-in halo finder PHEW (Bleuler et al. 2015). By defining galaxies in this manner, we ensured a robust identification of galactic structures while maintaining consistency with established methods in the literature. This definition forms the basis for our subsequent analysis of the spatial distribution of dust and UV emission within high-redshift galaxies.
2.4. High-z galaxies in CoDa III: An illustrative overview
To illustrate the appearance of galaxies in CoDa III, we show in Fig. 1 maps of several properties of the baryons in a massive MDM = 6.1 × 10¹¹ M⊙z = 7 galaxy. All coordinates and quantities use the physical reference frame as opposed to co-moving frame, hence the ‘pkpc’ in the labels. The red circle in each panel denotes RFoF, the FOF radius of the halo as defined in Sect. 2.3.
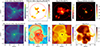 |
Fig. 1. Physical properties of a representative galaxy at z = 7 with MDM = 6.1 × 10¹¹ M⊙. The red circle in each panel indicates RFoF. Top row: Projected quantities integrated along the line of sight. Bottom row: 1-cell-thick slice at the position of maximum density. (a) H column density, (b) Dust column density, (c) Stellar mass surface density, (d) Intrinsic (unattenuated) absolute UV magnitude at 1600 Å, (e) H number density, (f) Temperature, (g) HI fraction, and (h) Metallicity (absolute scale). |
The top row shows the following projected quantities integrated along the line of sight:
-
Panel (a) displays the H column density, revealing the overall gas distribution of the galaxy halo and its surroundings. We describe the gas distribution from the centre outwards. The gas distribution features a central concentration, with some elongation, i.e. it is not spherical. It also shows signs of perturbations, such as a gaseous arc to the bottom left of the centre, reminiscent of a gas tidal stream, suggesting ongoing or very recent merging activity, contributing to the disturbed appearance of the central structure. An infalling group of gas structures is also seen above and to the left of the halo centre, supporting the notion that merging is intense and frequent in this location and at this epoch. Further out, filaments extend out all the way to and beyond RFoF. Along these filaments, smaller gas clumps are found, corresponding to a population of smaller, infalling sub-haloes and galaxies.
-
Panel (b) shows the dust column density, which is also concentrated within the central regions, with smaller clumps co-located with the infalling sub-haloes of panel (a). The 0.075 factor justified in Sect. 2.6 is accounted for. We note that the maps of panels (a) and (b) are reminiscent of the structures reported in the proto-giant galaxy SPT2349−56 by Sulzenauer et al. (2025).
-
Panel (c) presents the stellar mass surface density. It features a centrally concentrated stellar component, with a few clumps corresponding to the infalling sub-haloes. It also displays some extended, low-density structure.
-
Panel (d) depicts the intrinsic unextincted absolute UV magnitude at 1600 Å, highlighting the regions of recent star formation. Indeed, only the latter have a significant output at 1600 Å. The extended structure of panel (c) is less prominent in this panel, because it corresponds to an older, passively evolving stellar component.
The bottom row presents the following 1-cell-thick slices at the position of maximum density, allowing us to see fine structures that are not visible in the projected maps:
-
Panel (e) shows the H number density slice, revealing detailed gas structures including filaments and clumps, but also gas shells typical of supernova (SN)-driven winds.
-
Panel (f) displays the temperature slice, where the high temperature of the gas shells seen in (e) confirms their origin as SN-induced shocks and winds, reaching all the way to RFoF and in places slightly beyond. The several quasi-concentric shells likely originate from a series of distinct, strong episodes of star formation. Remarkably, the most central region of the galaxy remains cool despite the intense star formation activity. Beyond xHI = 10−2, the un-shocked intergalactic medium sits at a typical photo-heated temperature of ∼104 K.
-
Panel (g) presents the neutral hydrogen fraction slice, showing the ionisation state of the gas. The halo and its surroundings are highly ionised except at the very centre of the galaxy, which remains neutral. Some fractions of connecting filaments, at or beyond RFoF, are moderately neutral, with xHI = 10−2. The rest of the halo is strongly ionised, reflecting the high-temperatures of the circumgalactic medium, with extreme ionisation shells (xHI = 10−6) accompanying the SN shocks. Beyond the range of SN winds, the photo-ionised intergalactic medium has a neutral fraction slightly below xHI = 10−4.
-
Panel (h) shows the metallicity slice, illustrating the enrichment of the ISM by stellar feedback, with higher metallicities in the galaxy centre and in outflowing gas, as well as uncontaminated, pristine gas beyond RFoF.
This multi-panel view provides a comprehensive picture of the galaxy’s physical properties, showcasing the complex interplay between gas, dust, stars, and feedback processes in high-redshift galaxies. Altogether, the structure we find is typical of simulations of early galaxies, their circum-galactic medium (CGM), and surrounding IGM and is similar to the distributions seen in, for example, Ocvirk et al. (2008) and Ocvirk et al. (2016). We note, however, that cold neutral cores are generally more prominent in massive galaxies than portrayed in Ocvirk et al. (2016)’s figures. This is likely a consequence of the increased mass and spatial resolution compared to CoDa II and of the changes in the sub-grid star formation model.
The dust-UV offsets we proposed to investigate take place at very small scales, in the centre-most regions of our galaxies. To illustrate the different scales of the dataset, panel (d) shows a green square indicating the size and position of the regions we consider and analyse in our galaxy sample throughout the rest of this paper.
2.5. Attenuated UV map generation
To produce synthetic observations for each galaxy, we extracted the dust data cube from the simulation for the region containing a dark matter halo and its associated stellar particles. We centred this cube on the peak of gas density within the halo. The intrinsic UV emission from the stellar particles was calculated using the Binary Population and Spectral Synthesis (BPASS) models Eldridge et al. (2017), consistent with the approach used in the CoDa III and DUSTiER simulations Lewis et al. (2022, 2023).
To simulate the absorption of UV photons by dust, we performed a 1D radiative transfer calculation along the z-direction, treating this direction as the line of sight to the observer. The dust grain properties, including the extinction curve, are based on the SMC model by Draine & Li (2001), as detailed in the DUSTiER paper (Lewis et al. 2023) and in Sect. 2.2. This ensured consistency in our treatment of dust across different aspects of the simulation and analysis4.
For simplicity, we accounted exclusively for absorption and did not consider the albedo of the grains or any subsequent reflection and/or diffusion of incident radiation. As a consequence, it may appear that our treatment overestimated the dust attenuation. However, since the absorption cross-section we used corresponds to (1-albedo) times the interaction cross-section, our treatment resembles the limiting case of a model with reflection on dust grains, where the reflected radiation (the albedo) is emitted in the same direction as the incident radiation. Because of the isotropic nature of the stellar sources, and the roughly spherical nature of our gas and dust distributions at the centre of the CoDa III galaxies, we expected that a full accounting of reflections and diffusions would not significantly alter our results, although this is admittedly a limitation in our study. Indeed, studies show that not accounting for scattering can affect the attenuation and extinction curve (Sommovigo et al. 2025; Cochrane et al. 2019; Narayanan et al. 2018). Probing these aspects (at the limited spatial resolution of CoDa III) would require more accurate dust radiative transfer post-processing such as SKIRT5 (Camps & Baes 2015), RASCAS6 (Michel-Dansac et al. 2020), or POWDERDAY (Narayanan et al. 2021).
2.6. Dust mass recalibration
The impact of dust on the UV luminosity function (UVLF) is strongest at the bright end. Due to its limited size (16 h−1 cMpc), DUSTiER (Lewis et al. 2023) could not probe this aspect beyond MAB1600 < −21. When analysing CoDa III, which ran using the DUSTiER calibration of the dust model, we found that in order to reproduce the UV galaxy luminosity function (LF)’s bright end, we had to reduce the raw simulation dust masses by a factor cdust = 0.075, and all the dust masses and densities used in the present paper take this factor into account. We note, however, that such a recalibration of the dust masses should not affect the re-ionisation history obtained for CoDa III by much. Indeed, as found in Lewis et al. (2023), the galaxy ionising escape fractions are dominated by HI opacity, and the dust < 912 Å opacity is sub-dominant at all halo masses and all redshifts of the simulation. While this is true in the CoDa III framework and spatial resolution, dust may not always be sub-dominant in determining the ionising escape fractions. Indeed, since dust grains do not ionise and become transparent as H does, dust may impact the ionising escape fraction and thereby the re-ionisation history, if the sources’ environment consists of a large dust density in a highly ionised hydrogen medium, as seen for instance in Glatzle et al. (2019).
To compute the UVLF presented in Fig. 2, we proceeded as follows. For any galaxy, we generated its attenuated UV map and integrated its flux spatially. Our LFs therefore account for dust attenuation by construction. The LFs are shown for several dust contents: the fiducial cdust = 0.075 reduction factor (shaded areas), the full dust content (dashed coloured lines), and no dust (dotted coloured lines). The full dust content cdust = 1.0 LFs are incompatible with the observations. Reducing the dust content moved the LFs towards the unattenuated limit. We settled on the cdust = 0.075 value as it yielded the best agreement with the observed LFs of Bouwens et al. (2021). This trend has also been reported in the literature. In Dayal et al. (2022), for instance, the model that best fits the dust masses undershoots the UVLFs, whereas the model that best reproduces the UVLFs has a smaller dust content. More recently, difficulties to match high-z LFs using the very high dust masses suggested by ALPINE and REBELS have also been reported in Toyouchi et al. (2025), Zhao & Furlanetto (2024).
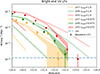 |
Fig. 2. Bright-end UV luminosity function of CoDa III galaxies for redshifts z = 5, 6, and 7 and various dust contents. The shaded areas represent the average dust-attenuated LFs plus or minus the Poisson noise for cdust = 0.075. The dotted lines represent the unattenuated LFs. The dashed lines represent the full dust content LFs (i.e. cdust = 1.0). The horizontal dot-dashed line represents the 1/V limit, where V is the volume of the simulated domain in Mpc3. The observed LFs are from Bouwens et al. (2021). |
Support for this chosen fiducial dust mass recalibration, cdust = 0.075, is also found in the UV slope β of our simulated galaxies. To obtain the UV slope, we computed two attenuated flux maps, as explained in Sect. 2.5, in a 200 Å -wide window centred on 1500 and 2500 Å. We then spatially integrated the map to obtain the fluxes, F1500 and F2500, and computed the UV slope as β = log(F2500/F1500)/log(2500/1500). The slopes are shown in Fig. 3 at three redshifts (z = 5, 6, and 7), along with the ALPINE and REBELS samples detailed in Sect. 2.8. For each redshift, we show the attenuated and unattenuated (MAB1600, β) distributions of simulated galaxies. The impact of dust on the simulated galaxies is clearly evident as significant dimming and reddening. The brightest, dust-attenuated CoDa III galaxies have a fair amount of overlap with the ALPINE and REBELS samples at z = 5. Our results also suggest that galaxies fainter than the REBELS and ALPINE samples should have bluer colours. The reasonable overlap between CoDa III and observed galaxies confirms our fiducial dust mass recalibration, cdust = 0.075.
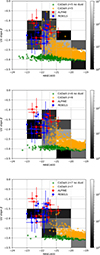 |
Fig. 3. MAB1600-β distributions of CoDa III galaxies (orange: dust-attenuated; green: unattenuated), along with the ALPINE and REBELS samples (red and blue symbols with error bars, respectively). The grey-shaded colours indicate the number of galaxies (dust-attenuated) residing in each cell, as a visual guide. Note that nebular continuum emission is not accounted for and can redden the spectra by up to Δβ = +0.3 (Wilkins et al. 2016). |
However, this recalibration degrades the agreement between our simulated dust masses and the observed dust masses, as seen in Fig. 4. The DUSTiER simulation (Lewis et al. 2023) was initially calibrated to match them and did so successfully. But, the reduction factor we introduced to match the UVLFs means that we now undershoot the observed dust masses, even including their significant error bars. We were unable to obtain good agreement simultaneously with the UVLFs at z = 5, 6, and 7 and the dust masses, necessitating a compromise, although this remains not fully satisfactory. Agreement with the UVLFs was prioritised, as these are considered more secure, due to fewer assumptions in their observational determinations, although this choice may reflect the authors’ personal bias.
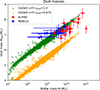 |
Fig. 4. Dust masses in the CoDa III simulation at z = 5 as a function of stellar mass, along with the ALPINE and REBELS samples. Green and orange colours correspond to 100% and 7.5% of the simulated galaxies’ dust masses, respectively. Our fiducial model for the post-processing of this study is the 7.5% case. |
Admittedly, the spatial resolution of CoDa III is limited to > 1 pkpc at z = 7, which may not fully capture the fine structure of dust and star formation in galaxies. In fact, it is reasonable to expect some amount of structure beyond the resolution of CoDa III. Galaxy effective radii, for instance, have often been determined to be smaller than 1 pkpc at z ∼ 7, albeit for galaxies fainter than the REBELS sample (Yang et al. 2022). Moreover, the galaxy itself may display structure beyond this limit, as shown in for example Arata et al. (2019) and Pallottini et al. (2022). Despite these limitations, we will see that our approach allows us to make meaningful comparisons between the large-scale distributions of dust and UV emission in our simulated galaxies, which is the primary focus of this study.
2.7. Dust maps
To complement our attenuated UV maps, we also generated dust maps for each galaxy. These maps were created by integrating the 3D dust density distribution along the same z-axis used for the UV maps.
It is worth noting that an accurate estimation of dust continuum emission typically requires accounting for the amount of UV light absorbed by dust, and computing the dust temperature, which determines the blackbody mean frequency, since this absorbed energy is re-radiated in the infrared. For the sake of simplicity in this study, we did not include this step in our dust map generation. Instead, we used the dust density projection as a proxy for dust emission. By doing this we assumed that far-IR diffusion on dust grains does not significantly affect the geometry (and at least the position of the maximum of emission), and that the dust temperature is constant across our galaxies.
Since the ALMA beam is comparable to our cell size at z = 5–7, we did not degrade our maps through, for example, a spatial convolution, as done for higher resolution simulations. Despite this simplification, our results demonstrate that this approach still effectively captures the key geometrical differences between the dust emission and UV-emitting stellar distributions, which are central to this study. While the absolute brightness of our dust continuum maps may not be precisely calibrated, their morphology and relative brightness distribution provide valuable insights into the dust structure of these early galaxies.
2.8. Observed offsets: ALPINE and REBELS
Our comparison with observations draws upon data from two major surveys of high-redshift galaxies: ALPINE and REBELS. These surveys provide crucial observational constraints on the spatial relationship between dust and UV emission in early galaxies.
The ALPINE survey (Le Fèvre et al. 2020; Béthermin et al. 2020) targeted 118 star-forming galaxies in the redshift range 4.4 < z < 5.9. For our analysis, we specifically used the subset of ALPINE galaxies that had both a [C II] line detection (providing a spectroscopic redshift) and a measured continuum-UV offset. This selection ensured that we could accurately convert the observed angular offsets to physical distances. It yields 14 galaxies.
The REBELS survey (Bouwens et al. 2022; Inami et al. 2022; Bowler et al. 2024) focused on 40 UV-bright galaxies at z > 6.5. These galaxies were selected based on their photometric redshifts, with spectroscopic confirmation coming from [C II] or [O III] line detections. We retained the galaxies for which offsets, stellar masses, and UV slopes β were computed in these articles. It is worth noting that we excluded one object from the REBELS sample in our analysis. The galaxy REBELS-19 showed an exceptionally large offset by approximately 8 pkpc, which appeared to be an outlier compared to the rest of the sample. While this object merits further investigation, we chose to omit it from our current analysis to avoid potentially skewing our results. This left us with 17 REBELS galaxies.
In both ALPINE and REBELS surveys, it should be recalled that comparing positions measured with such radically different instruments as ALMA and HST/JWST is not trivial. Great care must be taken to establish the error budget of each observation and assess the significance of the offsets. We refer to the discussion in Bowler et al. (2022) on this topic.
To ensure consistency in our comparison, we converted all angular offsets from both surveys to physical distances in kiloparsecs. This conversion was performed using the standard Planck cosmology (Planck Collaboration VI 2020), which is the same cosmology used in our CoDa III simulations. Specifically, we used the cosmological angular-size distance appropriate for each galaxy’s redshift.
By combining data from these two surveys, we assembled an observational dataset of dust-UV offsets in the early universe. This dataset provides a valuable benchmark against which we can compare our simulation results, allowing us to test the validity of our dust models and improve our understanding of the complex interplay between dust and star formation in high-redshift galaxies.
3. Results
3.1. UV and dust maps
Figure 5 shows (from left to right) the attenuated and intrinsic restframe UV maps, as well as the dust column density and the projected stellar density for four representative massive galaxies MDM > 5 × 10¹¹ M⊙ between z = 5 and z = 7. While Fig. 1 illustrates general galaxy structure and uses a wide dynamic range, we chose in Fig. 5 to use a more narrow dynamic range to be more representative of current instrumental detection limits. This can be easily seen by comparing the colour bars of the two figures for the same field.
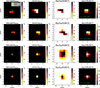 |
Fig. 5. From left to right: Restframe-UV absolute MAB1600 magnitudes, attenuated and intrinsic (unattenuated), dust column density, and projected stellar density maps of a sample of four CoDa III galaxies with dark matter halo masses MDM = 5 × 10¹¹ − 1012 M⊙ at z = 5–7. In the left panel, for each galaxy, symbols mark the positions of maximum attenuated UV flux (green ‘x’), maximum NIR flux – approximated by the maximum projected stellar density (green ‘+’) – and maximum dust column density (green ‘Y’). For the two leftmost plot columns, the colour indicates the absolute magnitude (attenuated or intrinsic) of each cell. The dust column density and projected stellar density are given in log10(M⊙/pkpc2). |
Similar to that noted in the global halo view in Sect. 2.4, the central distributions of the dust and stellar mass are not spherically symmetric. Instead, they display perturbed morphologies, suggestive of ongoing interaction with recent or current infalling and/or merging objects. We also mark the positions of maximum dust column density and maximum attenuated stellar UV flux with symbols. We use the position of the maximum of the stellar density as a proxy for the stellar restframe NIR maximum flux position, since stellar NIR flux is much less attenuated by dust than UV. These maps are projections of the simulation grid, centred on galaxy centres, at the native grid resolution of the simulation. The blocky appearance of the maps, therefore, reflects the cell size, which is 11.53 ckpc, i.e. 1.65 pkpc at z = 6.
We begin with a few simple remarks to check the correct behaviour of these outputs. The attenuated maps are significantly fainter than the intrinsic maps, as expected due to dust attenuation. The intrinsic UV maps have a morphology similar to that of the dust and stellar density maps for each galaxy. In all cases, the dust and NIR maximum flux coincide. However – and this is the most striking aspect of this gallery of maps – the attenuated maps differ significantly from all the others: only a fraction of the stellar distribution is seen in the attenuated maps. More critically, the attenuated UV maximum and the dust maximum, shown by the ‘+’ and ‘Y’ symbols, are frequently offset (e.g. rows one and two from the top). This is obviously due to dust extinction, since the faintest cells in the attenuated maps are those with the highest dust column density. Although such dust-UV offsets are common, in particular, at the highest halo masses, they are not systematic. The two bottom rows, for instance, show galaxies where all four maxima are co-located in the central cell. This configuration is more typical of CoDa III lower mass galaxies.
Such offsets driven by dust attenuation and complex morphology, clumpiness, or multiplicity have also been reported in the literature, for example, Arata et al. (2019). It has also been noted in Pallottini et al. (2022) that “the multi-phase ISM structure in these systems, consisting of IR-emitting molecular clumps embedded in a semi-transparent, UV-emitting diffuse component. This configuration also produces a UV vs. dust continuum spatial offset”. Cochrane et al. (2019) reports that UV and far-IR emission occupy strikingly different locations in their simulated galaxies, also driving significant offsets between UV and dust emission. This can also be seen in Fig. 4 of Behrens et al. (2018). Finally, while Punyasheel et al. (2025) does not specifically quantify the UV-dust offsets in their study, their Fig. 5 shows a mixture of clear and insignificant and/or null offsets.
3.2. Comparison to observed dust-UV offsets
To contextualise our findings within the broader observational landscape, we compare the dust-UV offsets found in our CoDa III simulations with those observed in high-redshift galaxies. Figure 6 presents this comparison.
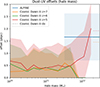 |
Fig. 6. Dust-UV offsets as a function of halo mass. The blue-shaded region represents the mean and dispersion of observed offsets in the ALPINE survey, with a tentative, rough dark-matter halo mass range estimate used to locate the sample on the horizontal axis. Coloured lines show the mean offsets in CoDa III simulations at different redshifts (z = 7, 6, and 5). Shaded regions around these lines indicate the 1σ dispersion. The dashed segments to the right represent the cell size of the simulation. |
In Fig. 6, we plot the dust-UV offsets against halo mass. The blue-shaded region represents the mean and dispersion of observed offsets from the combined ALPINE and REBELS surveys, providing a benchmark for comparison with our simulations. The coloured lines show the mean offsets found in our CoDa III simulation at three different redshifts: z = 7 (orange), z = 6 (green), and z = 5 (red). The shaded regions around these lines indicate the 1σ dispersion of the offsets in our simulated galaxies. To place the observed sample in this plot, we tentatively assign an approximate dark matter halo mass MDM = 1011.5 − 12.5 M⊙ to the ALPINE+REBELS sample. Several trends emerge from this comparison:
1. The mean simulated offsets increase with dark matter halo mass at z = 5, particularly for masses above 1011.5 M⊙.
2. For the most massive dark matter haloes (∼1012 M⊙), our simulated offsets at z = 5 are consistent with the observed mean offsets.
3. At lower halo masses, the simulated offsets fall below the cell size of the simulation, making these predictions less reliable. To help the reader gauge this aspect, the cell size is shown by the three dashed segments on the right of the figure, representing the physical cell size at each redshift considered. The cell size of the simulation is constant in co-moving kiloparsec and therefore increases with the scale factor. The low mass sample is compatible with a zero average offset given the significant dispersion we measure.
4. In light of the dispersion of our measurements for each mass bin and, in particular, at low mass where the offsets are smaller than the simulation’s spatial resolution, our results are compatible with a scenario where the offset distribution at a fixed halo mass does not evolve with redshift between z = 5–7. The lack of large offsets at z>5 arises simply from the lack of sufficiently massive haloes.
3.3. Dust-NIR distributions
To further investigate the nature of the dust-UV offsets observed in our simulations, we examined the spatial relationship between the dust and the bulk stellar component, as traced by the NIR emission. In practice, we computed the maximum of the projected, unattenuated stellar density and used it as a proxy for the location of the stellar rest-frame NIR emission. Figure 7 shows the offsets between dust and NIR emission as a function of dark matter halo mass for different redshifts.
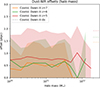 |
Fig. 7. Dust-NIR offsets as a function of dark matter halo mass in the CoDa III simulations. Coloured lines show the mean offsets at different redshifts (z = 7, 6, and 5), with shaded regions indicating the 1σ dispersion. The dashed segments to the right represent the evolving physical cell size of the simulation (CoDa III dx). |
The key finding here is that the mean dust-NIR offsets do not evolve with dark matter halo mass, unlike the dust-UV offsets as seen in Sect. 3.2. Their mean value remains well below the simulation’s cell size and crucially is much smaller than the dust-UV offsets above 1011.5 M⊙. The stark contrast between the large dust-UV offsets (Fig. 6) and the small dust-NIR offsets suggests that the former are not primarily due to a misalignment between dust and stars. Instead, the dust-UV offsets are principally the result of massive extinction by dust, which obscures the UV emission from the central regions of galaxies where both dust and stars are concentrated.
3.4. Dust-UV offsets as a function of UV magnitude
To further facilitate a more direct comparison with observations, we present the dust-UV offsets as a function of the observed (therefore dust-extincted) UV magnitude at 1600 Å (MAB1600), in Fig. 8. Several key features appear:
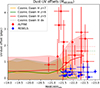 |
Fig. 8. Same as Fig. 6 but using the observed (dust-attenuated) absolute UV magnitude (MAB1600). The ALPINE and REBELS offsets are taken from Béthermin et al. (2020) and Inami et al. (2022), respectively. |
1. A trend with UV brightness: The dust-UV offsets generally increase as galaxies become brighter. This trend is consistent across all simulated redshifts and aligns well with the observational data from ALPINE, especially for CoDa III at z = 5.
2. The predicted offsets for galaxies brighter than –22 are comparable to the simulation’s resolution as per the cell size. This is also the region where the agreement with ALPINE observations is found.
3. The ALPINE offsets are significantly larger than the REBELS’s despite similar magnitudes. However, the large dispersion of CoDa III offsets at these magnitudes encompasses both ALPINE and REBELS samples.
4. For fainter galaxies (MAB1600 > −21), the mean of the simulated offsets falls below the cell size of the simulation (horizontal dashed lines), making these measurements less reliable.
5. Observational bias: The observational data are limited to relatively bright galaxies (MAB1600 < −21). Despite the insufficient spatial resolution in the fainter > − 21 regime, our results suggest that, taken at face value, dust-UV offsets should be smaller for fainter galaxies, a prediction that will be tested by deeper surveys and future numerical simulations.
6. Redshift evolution: As in the previous figures, there is no clear trend with redshift, beyond the fact that the latest epochs feature naturally more massive haloes. However, at a fixed mass, the curves for each redshift fall well within 1 σ of each other. Our results are therefore compatible with a null evolution of the offsets with redshifts between z = 5–7, at fixed mass.
3.5. Dust-UV offsets as a function of stellar mass
We now present the dust-UV offsets as a function of the observed stellar masses. Figure 9 presents the relationship between dust-UV offsets and stellar mass for both our simulations and observational data. Several key features appear, predominantly in line with the previous subsections, but with some nuances:
1. A trend with stellar mass: The dust-UV offsets become significantly larger on average only for the latest epoch and the most massive galaxies of the simulation. This is especially visible at z = 5.
2. Interestingly, there is a significant difference in this parameter space between the two observational samples, as the REBELS galaxies are on average less massive and display smaller offsets than their ALPINE counterparts. Strikingly, this difference is well described by CoDa III galaxies. Indeed, CoDa III galaxies at M* < 1010 M⊙ display small offsets (i.e. smaller than the simulation’s resolution), compatible with a zero average. The offset increases above this mass and connects with the ALPINE data. Our results suggest that stellar mass is the main parameter driving the larger offsets of ALPINE compared with REBELS.
3. Redshift evolution: As in the previous figures, there is no clear trend with redshift, beyond the fact that the latest epochs feature naturally more massive haloes. However, at a fixed mass, the curves for each redshift fall well within 1σ of each other. Our results are therefore compatible with a null evolution of the offsets with redshift between z = 5–7, at a fixed stellar mass.
4. Conclusions
Our study of dust-UV offsets in high-redshift galaxies using the CoDa III simulation has yielded several important findings:
-
Reproducing the observed UV LF at z = 5 − 7 requires us to apply a reduction factor, cdust = 0.075, to all dust masses in CoDa III. Without this factor, our UV LFs are too faint. With this reduction, we also find fair agreement with the ALPINE and REBELS UV slopes β.
-
Within this framework, the simulation successfully reproduces the observed spatial offsets between dust and UV emission in massive galaxies (MDM > 1011.5 M⊙), in particular at z = 5, with offsets increasing with dark matter halo mass and UV brightness.
-
These offsets primarily result from severe dust extinction in galactic centres rather than a misalignment between dust and stellar distributions. The dust generally remains well-aligned with the bulk stellar component, and we predict comparatively small dust-NIR offsets.
-
The amplitude of the offsets and their dependence on galaxy properties are in fair agreement with the observational data from the ALPINE surveys, particularly for the brightest galaxies (MAB1600 < −21.5) and at z = 5.
-
For these galaxies, the offsets we predict are comparable to or larger than the cell size and are, therefore, resolved by the CoDa III spatial grid.
-
Our results suggest that the larger offsets of the ALPINE galaxies are mainly due to their larger stellar masses as compared to the REBELS sample.
-
Our results also suggest that the dust-UV offsets should be smaller for fainter galaxies (MAB1600 > −21), a prediction that can be tested by future deeper surveys and numerical simulations.
These findings underscore the crucial role of dust in shaping the observed properties of high-redshift galaxies. They demonstrate that the complex dust-star geometry in early galaxies can lead to significant disparities between their apparent and intrinsic structures. This work provides a theoretical framework for interpreting current and future observations of galaxies during the EoR, and emphasises the importance of considering dust effects when studying galaxy formation and evolution in the early universe.
Future studies should improve on spatial resolution beyond CoDa III’s, such as in Trebitsch et al. (2021) and Kannan et al. (2025), as well as on the physical modelling of dust, as in Dubois et al. (2024). Balancing high-enough spatial resolution inside of galaxies (e.g. down to giant molecular clouds, for instance) and large enough volumes to capture the largest galaxies remains a very ambitious, until now impractical goal. However, there is some hope thanks to the increasing power of the new generation of exascale supercomputers. The future lies with a new generation of exascale astrophysical simulation codes, such as Delorme et al. (2024), to further our understanding of the formation and evolution of galaxies during the EoR and along cosmic time.
We remind here that employing instead a Large Magellanic Cloud extinction curve can lead to significantly different results, as shown in the appendix of Lewis et al. (2023).
The corresponding extinction curve, along with other models, can be found here: https://www.astro.princeton.edu/~draine/dust/dustmix.html
Acknowledgments
We thank the anonymous referee for a thorough review and eye-opening comments which significantly improved the paper. This work used resources of the Oak Ridge Leadership Computing Facility, in particular the Summit supercomputer, under project AST031. An award of computer time was provided by the Innovative and Novel Computational Impact on Theory and Experiment (INCITE) program. Our analysis made use of Python Jupyter notebooks, NumPy (Harris et al. 2020), Astropy (Astropy Collaboration 2022), and PyVO. We also utilised the TAP VizieR service at CDS, querying the catalog ‘J/A+A/643/A2’ (Béthermin et al. 2020). K.A. is supported by NRF-2021R1A2C1095136 and RS-2022-00197685.
References
- Algera, H. S. B., Inami, H., Sommovigo, L., et al. 2024, MNRAS, 527, 6867 [Google Scholar]
- Aoyama, S., Hou, K.-C., Shimizu, I., et al. 2017, MNRAS, 466, 105 [NASA ADS] [CrossRef] [Google Scholar]
- Arata, S., Yajima, H., Nagamine, K., Li, Y., & Khochfar, S. 2019, MNRAS, 488, 2629 [NASA ADS] [CrossRef] [Google Scholar]
- Astropy Collaboration (Price-Whelan, A. M., et al.) 2022, ApJ, 935, 167 [NASA ADS] [CrossRef] [Google Scholar]
- Aubert, D., & Teyssier, R. 2008, MNRAS, 387, 295 [NASA ADS] [CrossRef] [Google Scholar]
- Bakx, T. J. L. C., Sommovigo, L., Carniani, S., et al. 2021, MNRAS, 508, L58 [NASA ADS] [CrossRef] [Google Scholar]
- Barkana, R., & Loeb, A. 2001, Phys. Rep., 349, 125 [NASA ADS] [CrossRef] [Google Scholar]
- Behrens, C., Pallottini, A., Ferrara, A., Gallerani, S., & Vallini, L. 2018, MNRAS, 477, 552 [NASA ADS] [CrossRef] [Google Scholar]
- Bekki, K. 2013, MNRAS, 432, 2298 [Google Scholar]
- Béthermin, M., Fudamoto, Y., Ginolfi, M., et al. 2020, A&A, 643, A2 [Google Scholar]
- Bleuler, A., Teyssier, R., Carassou, S., & Martizzi, D. 2015, Comput. Astrophys. Cosmol., 2, 5 [NASA ADS] [CrossRef] [Google Scholar]
- Bosman, S. E. I., Davies, F. B., Becker, G. D., et al. 2022, MNRAS, 514, 55 [NASA ADS] [CrossRef] [Google Scholar]
- Bouwens, R. J., Oesch, P. A., Stefanon, M., et al. 2021, AJ, 162, 47 [NASA ADS] [CrossRef] [Google Scholar]
- Bouwens, R., Smit, R., Schouws, S., et al. 2022, ApJ, 931, 160 [NASA ADS] [CrossRef] [Google Scholar]
- Bowler, R. A. A., Cullen, F., McLure, R. J., Dunlop, J. S., & Avison, A. 2022, MNRAS, 510, 5088 [NASA ADS] [CrossRef] [Google Scholar]
- Bowler, R. A. A., Inami, H., Sommovigo, L., et al. 2024, MNRAS, 527, 5808 [Google Scholar]
- Burgarella, D., Nanni, A., Hirashita, H., et al. 2020, A&A, 637, A32 [NASA ADS] [CrossRef] [EDP Sciences] [Google Scholar]
- Camps, P., & Baes, M. 2015, Astron. Comput., 9, 20 [Google Scholar]
- Ceverino, D., Glover, S. C. O., & Klessen, R. S. 2017, MNRAS, 470, 2791 [NASA ADS] [CrossRef] [Google Scholar]
- Choban, C. R., Kereš, D., Hopkins, P. F., et al. 2022, MNRAS, 514, 4506 [NASA ADS] [CrossRef] [Google Scholar]
- Choban, C. R., Kereš, D., Sandstrom, K. M., et al. 2024, MNRAS, 529, 2356 [CrossRef] [Google Scholar]
- Cochrane, R. K., Hayward, C. C., Anglés-Alcázar, D., et al. 2019, MNRAS, 488, 1779 [NASA ADS] [CrossRef] [Google Scholar]
- Dayal, P., & Ferrara, A. 2018, Phys. Rep., 780, 1 [Google Scholar]
- Dayal, P., Ferrara, A., Sommovigo, L., et al. 2022, MNRAS, 512, 989 [NASA ADS] [CrossRef] [Google Scholar]
- Delorme, M., Durocher, A., Aubert, D., Brun, A. S., & Marchal, O. 2024, in SF2A-2024: Proceedings of the Annual meeting of the French Society of Astronomy and Astrophysics, eds. M. Béthermin, K. Baillié, & N. Lagarde, et al., 169 [Google Scholar]
- Deparis, N., Aubert, D., Ocvirk, P., Chardin, J., & Lewis, J. 2019, A&A, 622, A142 [NASA ADS] [CrossRef] [EDP Sciences] [Google Scholar]
- Draine, B. T. 2003, ARA&A, 41, 241 [NASA ADS] [CrossRef] [Google Scholar]
- Draine, B. T., & Li, A. 2001, ApJ, 551, 807 [NASA ADS] [CrossRef] [Google Scholar]
- Dubois, Y., Rodríguez Montero, F., Guerra, C., et al. 2024, A&A, 687, A240 [NASA ADS] [CrossRef] [EDP Sciences] [Google Scholar]
- Eldridge, J. J., Stanway, E. R., Xiao, L., et al. 2017, PASA, 34 [Google Scholar]
- Ferrara, A., Sommovigo, L., Dayal, P., et al. 2022, MNRAS, 512, 58 [NASA ADS] [CrossRef] [Google Scholar]
- Fudamoto, Y., Oesch, P. A., Faisst, A., et al. 2020, A&A, 643, A4 [NASA ADS] [CrossRef] [EDP Sciences] [Google Scholar]
- Garaldi, E., Kannan, R., Smith, A., et al. 2022, MNRAS, 512, 4909 [NASA ADS] [CrossRef] [Google Scholar]
- Gjergo, E., Granato, G. L., Murante, G., et al. 2018, MNRAS, 479, 2588 [NASA ADS] [CrossRef] [Google Scholar]
- Glatzle, M., Ciardi, B., & Graziani, L. 2019, MNRAS, 482, 321 [NASA ADS] [CrossRef] [Google Scholar]
- Gnedin, N. Y. 2014, ApJ, 793, 29 [CrossRef] [Google Scholar]
- Gnedin, N. Y. 2016, ApJ, 825, L17 [Google Scholar]
- Granato, G. L., Ragone-Figueroa, C., Taverna, A., et al. 2021, MNRAS, 503, 511 [NASA ADS] [CrossRef] [Google Scholar]
- Graziani, L., Schneider, R., Ginolfi, M., et al. 2020, MNRAS, 494, 1071 [NASA ADS] [CrossRef] [Google Scholar]
- Harris, C. R., Millman, K. J., van der Walt, S. J., et al. 2020, Nature, 585, 357 [NASA ADS] [CrossRef] [Google Scholar]
- Inami, H., Algera, H. S. B., Schouws, S., et al. 2022, MNRAS, 515, 3126 [NASA ADS] [CrossRef] [Google Scholar]
- Kannan, R., Puchwein, E., Smith, A., et al. 2025, arXiv e-prints [arXiv:2502.20437] [Google Scholar]
- Khusanova, Y., Béthermin, M., Le Fèvre, O., et al. 2021, A&A, 649, A152 [NASA ADS] [CrossRef] [EDP Sciences] [Google Scholar]
- Killi, M., Ginolfi, M., Popping, G., et al. 2024, MNRAS, 531, 3222 [Google Scholar]
- Le Fèvre, O., Bèthermin, M., Faisst, A., et al. 2020, A&A, 643, A1 [Google Scholar]
- Lewis, J. S. W., Ocvirk, P., Dubois, Y., et al. 2022, MNRAS, 516, 3686 [Google Scholar]
- Lewis, J. S. W., Ocvirk, P., Sorce, J. G., et al. 2023, MNRAS, 519, 5987 [CrossRef] [Google Scholar]
- Li, Q., Narayanan, D., & Davé, R. 2019, MNRAS, 490, 1425 [CrossRef] [Google Scholar]
- Li, Q., Narayanan, D., Torrey, P., Davé, R., & Vogelsberger, M. 2021, MNRAS, 507, 548 [NASA ADS] [CrossRef] [Google Scholar]
- Mancini, M., Schneider, R., Graziani, L., et al. 2015, MNRAS, 451, L70 [CrossRef] [Google Scholar]
- McKinnon, R., Torrey, P., & Vogelsberger, M. 2016, MNRAS, 457, 3775 [CrossRef] [Google Scholar]
- Michel-Dansac, L., Blaizot, J., Garel, T., et al. 2020, A&A, 635, A154 [EDP Sciences] [Google Scholar]
- More, S., Kravtsov, A. V., Dalal, N., & Gottlöber, S. 2011, ApJS, 195, 4 [NASA ADS] [CrossRef] [Google Scholar]
- Narayanan, D., Conroy, C., Davé, R., Johnson, B. D., & Popping, G. 2018, ApJ, 869, 70 [Google Scholar]
- Narayanan, D., Turk, M. J., Robitaille, T., et al. 2021, ApJS, 252, 12 [NASA ADS] [CrossRef] [Google Scholar]
- Novak, M., Smolčić, V., Delhaize, J., et al. 2017, A&A, 602, A5 [NASA ADS] [CrossRef] [EDP Sciences] [Google Scholar]
- Ocvirk, P., Pichon, C., & Teyssier, R. 2008, MNRAS, 390, 1326 [Google Scholar]
- Ocvirk, P., Gillet, N., Shapiro, P. R., et al. 2016, MNRAS, 463, 1462 [Google Scholar]
- Ocvirk, P., Aubert, D., Chardin, J., Deparis, N., & Lewis, J. 2019, A&A, 626, A77 [NASA ADS] [CrossRef] [EDP Sciences] [Google Scholar]
- Ocvirk, P., Aubert, D., Sorce, J. G., et al. 2020, MNRAS, 496, 4087 [NASA ADS] [CrossRef] [Google Scholar]
- Ocvirk, P., Lewis, J. S. W., Gillet, N., et al. 2021, MNRAS, 507, 6108 [NASA ADS] [CrossRef] [Google Scholar]
- O’Shea, B. W., Wise, J. H., Xu, H., & Norman, M. L. 2015, ApJ, 807, L12 [CrossRef] [Google Scholar]
- Pallottini, A., Ferrara, A., Gallerani, S., et al. 2022, MNRAS, 513, 5621 [NASA ADS] [Google Scholar]
- Planck Collaboration VI. 2020, A&A, 641, A6 [NASA ADS] [CrossRef] [EDP Sciences] [Google Scholar]
- Punyasheel, P., Vijayan, A., & Greve, T. 2024, in EAS2024, European Astronomical Society Annual Meeting, 126 [Google Scholar]
- Punyasheel, P., Vijayan, A. P., Greve, T. R., et al. 2025, A&A, 696, A234 [NASA ADS] [CrossRef] [EDP Sciences] [Google Scholar]
- Rosdahl, J., Katz, H., Blaizot, J., et al. 2018, MNRAS, 479, 994 [NASA ADS] [Google Scholar]
- Roy, F., Bouillot, V. R., & Rasera, Y. 2014, A&A, 564, A13 [NASA ADS] [CrossRef] [EDP Sciences] [Google Scholar]
- Sommovigo, L., Ferrara, A., Pallottini, A., et al. 2020, MNRAS, 497, 956 [NASA ADS] [CrossRef] [Google Scholar]
- Sommovigo, L., Ferrara, A., Pallottini, A., et al. 2022, MNRAS, 513, 3122 [NASA ADS] [CrossRef] [Google Scholar]
- Sommovigo, L., Cochrane, R. K., Somerville, R. S., et al. 2025, ApJ, 990, 114 [Google Scholar]
- Sorce, J. G., & Tempel, E. 2018, MNRAS, 476, 4362 [NASA ADS] [CrossRef] [Google Scholar]
- Sorce, J. G., Gottlöber, S., Yepes, G., et al. 2016, MNRAS, 455, 2078 [NASA ADS] [CrossRef] [Google Scholar]
- Sulzenauer, N., Weiß, A., Hill, R., et al. 2025, arXiv e-prints [arXiv:2509.08035] [Google Scholar]
- Teyssier, R. 2002, A&A, 385, 337 [CrossRef] [EDP Sciences] [Google Scholar]
- Toyouchi, D., Yajima, H., Ferrara, A., & Nagamine, K. 2025, MNRAS, 541, 3606 [Google Scholar]
- Trebitsch, M., Blaizot, J., Rosdahl, J., Devriendt, J., & Slyz, A. 2021, A&A, 650, A111 [NASA ADS] [CrossRef] [EDP Sciences] [Google Scholar]
- Watson, W. A., Iliev, I. T., D’Aloisio, A., et al. 2013, MNRAS, 433, 1230 [Google Scholar]
- Wilkins, S. M., Feng, Y., Di-Matteo, T., et al. 2016, MNRAS, 460, 3170 [Google Scholar]
- Wise, J. H. 2019, Contemp. Phys., 60, 145 [NASA ADS] [CrossRef] [Google Scholar]
- Yang, L., Morishita, T., Leethochawalit, N., et al. 2022, ApJ, 938, L17 [NASA ADS] [CrossRef] [Google Scholar]
- Zavala, J. A., Casey, C. M., Manning, S. M., et al. 2021, ApJ, 909, 165 [CrossRef] [Google Scholar]
- Zhao, R. J., & Furlanetto, S. R. 2024, JCAP, 2024, 018 [CrossRef] [Google Scholar]
All Figures
|
Fig. 1. Physical properties of a representative galaxy at z = 7 with MDM = 6.1 × 10¹¹ M⊙. The red circle in each panel indicates RFoF. Top row: Projected quantities integrated along the line of sight. Bottom row: 1-cell-thick slice at the position of maximum density. (a) H column density, (b) Dust column density, (c) Stellar mass surface density, (d) Intrinsic (unattenuated) absolute UV magnitude at 1600 Å, (e) H number density, (f) Temperature, (g) HI fraction, and (h) Metallicity (absolute scale). |
| In the text | |
|
Fig. 2. Bright-end UV luminosity function of CoDa III galaxies for redshifts z = 5, 6, and 7 and various dust contents. The shaded areas represent the average dust-attenuated LFs plus or minus the Poisson noise for cdust = 0.075. The dotted lines represent the unattenuated LFs. The dashed lines represent the full dust content LFs (i.e. cdust = 1.0). The horizontal dot-dashed line represents the 1/V limit, where V is the volume of the simulated domain in Mpc3. The observed LFs are from Bouwens et al. (2021). |
| In the text | |
|
Fig. 3. MAB1600-β distributions of CoDa III galaxies (orange: dust-attenuated; green: unattenuated), along with the ALPINE and REBELS samples (red and blue symbols with error bars, respectively). The grey-shaded colours indicate the number of galaxies (dust-attenuated) residing in each cell, as a visual guide. Note that nebular continuum emission is not accounted for and can redden the spectra by up to Δβ = +0.3 (Wilkins et al. 2016). |
| In the text | |
|
Fig. 4. Dust masses in the CoDa III simulation at z = 5 as a function of stellar mass, along with the ALPINE and REBELS samples. Green and orange colours correspond to 100% and 7.5% of the simulated galaxies’ dust masses, respectively. Our fiducial model for the post-processing of this study is the 7.5% case. |
| In the text | |
|
Fig. 5. From left to right: Restframe-UV absolute MAB1600 magnitudes, attenuated and intrinsic (unattenuated), dust column density, and projected stellar density maps of a sample of four CoDa III galaxies with dark matter halo masses MDM = 5 × 10¹¹ − 1012 M⊙ at z = 5–7. In the left panel, for each galaxy, symbols mark the positions of maximum attenuated UV flux (green ‘x’), maximum NIR flux – approximated by the maximum projected stellar density (green ‘+’) – and maximum dust column density (green ‘Y’). For the two leftmost plot columns, the colour indicates the absolute magnitude (attenuated or intrinsic) of each cell. The dust column density and projected stellar density are given in log10(M⊙/pkpc2). |
| In the text | |
|
Fig. 6. Dust-UV offsets as a function of halo mass. The blue-shaded region represents the mean and dispersion of observed offsets in the ALPINE survey, with a tentative, rough dark-matter halo mass range estimate used to locate the sample on the horizontal axis. Coloured lines show the mean offsets in CoDa III simulations at different redshifts (z = 7, 6, and 5). Shaded regions around these lines indicate the 1σ dispersion. The dashed segments to the right represent the cell size of the simulation. |
| In the text | |
|
Fig. 7. Dust-NIR offsets as a function of dark matter halo mass in the CoDa III simulations. Coloured lines show the mean offsets at different redshifts (z = 7, 6, and 5), with shaded regions indicating the 1σ dispersion. The dashed segments to the right represent the evolving physical cell size of the simulation (CoDa III dx). |
| In the text | |
|
Fig. 8. Same as Fig. 6 but using the observed (dust-attenuated) absolute UV magnitude (MAB1600). The ALPINE and REBELS offsets are taken from Béthermin et al. (2020) and Inami et al. (2022), respectively. |
| In the text | |
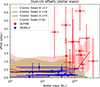 |
Fig. 9. Same as in Fig. 8 but as a function of stellar mass. |
| In the text | |
Current usage metrics show cumulative count of Article Views (full-text article views including HTML views, PDF and ePub downloads, according to the available data) and Abstracts Views on Vision4Press platform.
Data correspond to usage on the plateform after 2015. The current usage metrics is available 48-96 hours after online publication and is updated daily on week days.
Initial download of the metrics may take a while.