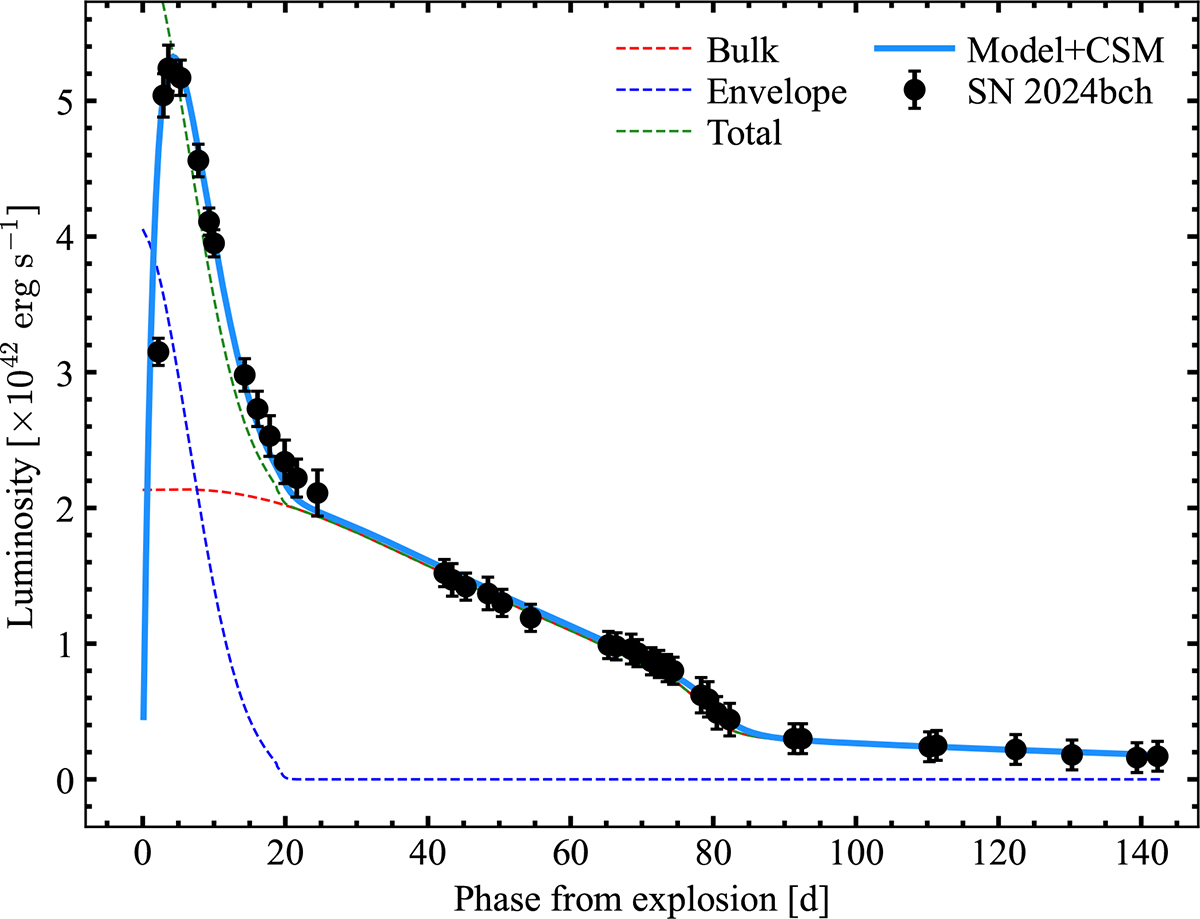
Fig. 5.
Download original image
Evolution of the bolometric luminosity of SN 2024bch along with the model used to reproduce the observed data. Dashed lines represent the luminosity contribution from both the envelope and the bulk of the ejecta. The solid green line is the sum of the two components, while the solid light blue line shows the contribution of the extra diffusion time introduced by the CSM.
Current usage metrics show cumulative count of Article Views (full-text article views including HTML views, PDF and ePub downloads, according to the available data) and Abstracts Views on Vision4Press platform.
Data correspond to usage on the plateform after 2015. The current usage metrics is available 48-96 hours after online publication and is updated daily on week days.
Initial download of the metrics may take a while.