| Issue |
A&A
Volume 703, November 2025
|
|
|---|---|---|
| Article Number | A177 | |
| Number of page(s) | 15 | |
| Section | Stellar structure and evolution | |
| DOI | https://doi.org/10.1051/0004-6361/202452359 | |
| Published online | 24 November 2025 | |
Signatures of anti-social mass loss in the ordinary Type II SN 2024bch
A non-interacting supernova with early high-ionisation features
1
INAF – Osservatorio Astronomico d’Abruzzo, via Mentore Maggini snc I-64100, Teramo, Italy
2
INAF – Osservatorio Astronomico di Padova, vicolo dell’Osservatorio 5, I-35122 Padova, Italy
3
INAF – Osservatorio Astronomico di Brera, via E. Bianchi 46, I-23807 Merate, Italy
4
Dipartimento di Fisica e Astronomia, Università degli Studi di Padova, Via F. Marzolo 8, I-35131 Padova, Italy
5
INAF – Osservatorio Astronomioco di Roma (OAR), via Frascati 33, 00078 Monte Porzio Catone (RM), Italy
6
Dipartimento di Scienze Fisiche e Chimiche, Università degli Studi dell’Aquila, via Vetoio 42, I-67100 L’Aquila, Italy
7
INAF – Osservatorio Astronomico di Capodimonte, Salita Moiariello 16, I-80131 Napoli, Italy
⋆ Corresponding author: This email address is being protected from spambots. You need JavaScript enabled to view it.
Received:
24
September
2024
Accepted:
12
September
2025
Abstract
In this paper we analyse the spectro-photometric properties of the Type II supernova SN 2024bch, which exploded in NGC 3206 at a distance of 19.9 Mpc. Its early spectra are characterised by narrow high-ionisation emission lines, which are often interpreted as signatures of ongoing interaction between rapidly expanding ejecta and a confined dense circumstellar medium. However, we provide a model for the bolometric light curve of the transient that does not require sources of energy other than radioactive decays and H recombination. Our model can reproduce the bolometric light curve of SN 2024bch if we adopt an ejected mass of Mbulk ≃ 5 M⊙ surrounded by an extended envelope of only 0.2 M⊙ with an outer radius Renv = 7.0 × 1013 cm. Accurate modelling focused on the radioactive part of the light curve, which accounts for incomplete γ-ray trapping, gives a 56Ni mass of 0.048 M⊙. We propose that narrow lines are powered by Bowen fluorescence that is induced by scattering of He II Lyα photons. Simple light travel time calculations based on the maximum phase of the narrow emission lines place the inner radius of the H-rich, un-shocked shell at a radius ≃ 4.4 × 1015 cm, consistent with no interaction occurring between the ejecta and the surrounding circumstellar material during the initial weeks of evolution. Possible signatures of interaction appear only ∼ 69 days after the explosion, although the resulting conversion of kinetic energy into radiation does not seem to contribute significantly to the total luminosity of the transient.
Key words: circumstellar matter / supernovae: general / supernovae: individual: SN 2024bch
© The Authors 2025
 Open Access article, published by EDP Sciences, under the terms of the Creative Commons Attribution License (https://creativecommons.org/licenses/by/4.0), which permits unrestricted use, distribution, and reproduction in any medium, provided the original work is properly cited.
This article is published in open access under the Subscribe to Open model. This email address is being protected from spambots. You need JavaScript enabled to view it. to support open access publication.
1. Introduction
Core-collapse supernovae (CC SNe) are the endpoint of the evolution of massive stars (M ≳ 8 − 9 M⊙; Heger et al. 2003). Hydrogen-rich CC SNe (called ‘Type II’ SNe) are the most common kind of explosion, with a further classification based on their photometric evolution, which either shows a ‘plateau’ (Type IIP) or a ‘linear’ (Type IIL) decline after maximum light (Hillier & Dessart 2019). It has been suggested that linearly evolving Type II SNe arise from stars that are partially depleted of their outer H layer, with relatively large radii (∼ 103 R⊙ ; Blinnikov & Bartunov 1993) compared to the more compact red supergiant (RSG) progenitors associated with Type IIP SNe (see e.g. Smartt 2009).
Narrow emission lines (full-width-at-half-maximum – FWHM – 102 − 103 km s−1) are generally associated with SNe that explode within an extended circumstellar medium (CSM), where such features dominate the observed spectra throughout the entire evolution of the transients, as in the case of the H–rich Type IIn (e.g. Schlegel 1990; Chevalier & Fransson 1994) and He–rich Type Ibn SNe (e.g. Pastorello et al. 2016; see also Smith 2017 and Blinnikov 2017 for more recent reviews). The collision of the rapidly expanding SN ejecta (∼104 km s−1) with the surrounding medium and the subsequent efficient conversion of kinetic energy into radiation may also contribute significantly to the energy output of these transients and produce slow-evolving transients (see e.g. Taddia et al. 2013; Fransson et al. 2014; Tartaglia et al. 2020; Taddia et al. 2020).
Early observations (from a few hours to a few days after the explosion; see e.g. Tartaglia et al. 2021, and references therein) of CC SNe may also show narrow, high-ionisation lines (e.g. He II, N III and, occasionally, CIII/IV and NIV/V, OIV/V; see Gal-Yam et al. 2014; Yaron et al. 2017; Bruch et al. 2023). These features are believed to arise from shells that are expelled during the very last evolutionary stages of the progenitors and hence may reflect physical and chemical properties of their outer layers. In this scenario, early narrow features would be the result of photo-ionisation from the SN shock breakout (the first electromagnetic signal from a SN; e.g. Ensman & Burrows 1992; Tominaga et al. 2011). The presence of a surrounding shell may drastically extend the duration of the shock breakout signal, which, in Type II SNe, is expected to have a timescale ≳ 100 s at most (see e.g. Moriya et al. 2015, and references therein), depending on the radius of the progenitor star. An extension of a few days may have different explanations, including photon diffusion in a dense CSM (e.g. Balberg & Loeb 2011) and an aspherical explosion (e.g. Suzuki & Shigeyama 2010). Energetic photons produced in shocked regions may also help to increase the lifespan of narrow lines, until the emitting shell is reached and swept away by the expanding SN ejecta. This scenario, on the other hand, should also result in a drastic change in the profiles of narrow features, which is typically not observed. Inflated envelopes have also been invoked to explain the relatively long duration of the shock breakout signal of the Type Ib SN 2008D (Soderberg et al. 2008; Modjaz et al. 2009). Moriya et al. (2015) argued that such an extension may also affect the early spectroscopic evolution of SNe that arise from H-rich progenitors.
High-ionisation features were observed in early spectra of Type II SNe, including SNe 1983K (Niemela et al. 1985; Phillips et al. 1990), 1998S (Leonard et al. 2000; Shivvers et al. 2015), 2006bp (Quimby et al. 2007), PTF11iqb (Smith et al. 2015), LSQ13fn (Polshaw et al. 2016), 2013fs (Yaron et al. 2017), 2014G (Terreran et al. 2016), 2016bkv (Hosseinzadeh et al. 2018), 2017ahn (Tartaglia et al. 2021) 2020pni (Terreran et al. 2022), and 2020tlf (Jacobson-Galán et al. 2022). More recent and well-studied transients that show similar early features include SN 2022jox (Andrews et al. 2024) and the nearby 2023ixf (e.g. Jacobson-Galán et al. 2023; Smith et al. 2023) and thanks to modern dedicated surveys, such as Distance Less Than 40 Mpc (DLT40; Tartaglia et al. 2018) and Zwicky Transient Facility (ZTF; Graham et al. 2019; Bellm et al. 2019; Masci et al. 2019), the number of discoveries has increased dramatically in recent years. Bruch et al. (2023) claim that the rate of SNe that show such features is expected to be relatively high (>30% at 95% confidence level).
Here we report the results of our analysis of the UV to Optical data of SN 2024bch, which were obtained soon after discovery and cover up to the early nebular phases (corresponding to the first seasonal gap). Analysis of later data will be performed and presented in a forthcoming paper once SN 2024bch is again observable using ground-based facilities. The transient was discovered on 2024 January 29.27 UT (Wiggins 2024) in the nearby SB(s)cd NGC 3206 (de Vaucouleurs et al. 1991), at α = 10:21:49.740, δ = +56:55:40.51 [J2000] (see Fig. 1), which, at a distance of 19.9±4.1 Mpc (Tully et al. 2016) and adopting an inclination of 61 1 (as reported in the HyperLeda database1; Makarov et al. 2014) corresponds to a de-projected distance of 3.9 kpc from the host centre. The SN was confirmed by ongoing transient surveys2 such as the Gravitational-wave Optical Transient Observer (GOTO; Steeghs et al. 2022), the Asteroid impact early warning system (ATLAS; Smith et al. 2020), ZTF, and the Panoramic Survey Telescope & Rapid Response System (Pan-STARRS; Chambers et al. 2016) within the Young Supernova Experiment (YSE; Jones et al. 2021); it was assigned the internal names GOTO24hm, ATLAS24bmx, ZTF24aaghpeh, and PS24aap, respectively. Additional photometric points were later provided by the Mobile Astronomical System of Telescope-Robots (MASTER; Lipunov et al. 2004) and by the ESA Gaia Photometric Science Alerts Team3, who further labelled the transient MASTER OT J102149.74+565540.4 and Gaia24bdk. Low-resolution spectroscopy was used to classify SN 2024bch as a young SN with high-ionisation features (Balcon 2024; Mujortova et al. 2024). We then started our UV to optical follow-up campaign detailed in Sect 2, which revealed a spectro-photometric evolution consistent with that of a Type II SN, with narrow features that disappeared a few days after discovery and little or no contribution from a source of energy in addition to the ‘canonical’ H recombination and radioactive decays, as we discuss in Sect. 3. A summary of our main results is reported in Sect. 4.
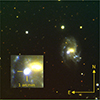 |
Fig. 1. Colour image of SN 2024bch and its host galaxy NGC 3206, obtained combining u-, g-, r-, and i-band data obtained on 2024 February 5 with the 1.82 m Copernico telescope with AFOSC. The transient is the bright source in the middle of the inset. |
2. Observations and data reduction
The follow-up campaign of SN 2024bch started soon after discovery (corresponding to 2024 January 29.29 UT; Wiggins 2024), with early photometry obtained on 2024 January 29.92 UT and low-resolution spectroscopy on 2024 January 29.95 UT (see Table 1). Optical observations were mostly carried out with facilities of the Istituto Nazionale di Astrofisica (INAF) – Osservatorio Astronomico di Padova (i.e., the 1.82 m Copernico with the Asiago Faint Object Spectrograph and Camera – AFOSC – and the 69/92 cm Schmidt with a G4-16000LC Moravian camera, both located in Asiago). Additional ugriz photometry were provided by the Wide-field Optical Telescope (WOT), a 67/91 cm Schmidt telescope equipped with an Apogee Aspen CG16M camera located at the Campo Imperatore observatory in l’Aquila (Italy). These data were reduced using the dedicated pipeline SuperNOva PhotometrY (SNOOPY4) fitting the point spread function (PSF) computed on selected non-saturated stars in the field and zero-point calibration using stars from the Sloan Digital Sky Survey (SDSS) catalogue (Data Release 17 – DDR17; Abdurro’uf et al. 2022). Further details on the reduction steps within SNOOPY are available in Tartaglia (2016).
Log of the spectroscopic observations of SN 2024bch.
Near ultra-violet (NUV) observations were carried out using the 0.3 m Ultra-Violet Optical Telescope (UVOT) on board the Swift Gamma Ray Burst Explorer (Gehrels & Swift 2004). These were reduced using HEASOFT V. 6.33 (Nasa High Energy Astrophysics Science Archive Research Center (Heasarc) 2014) on pre-processed images retrieved from the Swift archive5, following the prescription of Brown et al. (2009). The field of SN 2024bch was also monitored by ZTF and we later used its forced-photometry service (Masci et al. 2019) to collect extra g- and r-band epochs that spanned a period of approximately 4 years prior discovery. UV and UBV photometry were both calibrated in the Vega photometric system, while ugriz magnitudes were referred to the AB system. Optical spectroscopy was reduced using the FOSCGUI pipeline6 designed for the reduction of AFOSC data and performing standard IRAF (Tody 1986, 1993) reduction steps through PYRAF (Science Software Branch at STScI 2012).
3. Analysis and modelling
3.1. Photometric evolution
The photometric monitoring of SN 2024bch started soon after its discovery (≃ 0.4 days after the report by Wiggins 2024, see Section 1). The GOTO collaboration later provided an earlier discovery on 2024 January 29.05 UT (∼ 0.5 days earlier), with a non-detection on 2024 January 28.04 UT, which corresponds to JD = 2460337.5. If we take the midpoint between the GOTO reported epochs, we then assume the explosion occurred on JD = 2460338.0±0.5 and refer phases to this epoch. Forced photometry on archival ZTF images (Masci et al. 2019) did not show evidence of variability down to limiting magnitudes of g > 20.5, r > 20.6 mag approximately 4 years prior to discovery, which rules out pre-SN outbursts with an absolute peak magnitude brighter than ≃ −11 mag.
Details on the instruments used and data reduction can be found in Sect. 2 while light curves are shown in Figure 2. The early evolution is fast, with rise times that span from ≃4.4 to ≃ 16.3 days, in the u- and z-band, respectively, which were estimated using fifth order polynomials to the early light curve and adopting the explosion epoch reported above. Within the first ∼ 1.6 days after explosion, optical magnitudes rise at an average rate of 3 mag day−1, which confirms that SN 2024bch was discovered very soon after explosion.
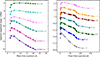 |
Fig. 2. UltraViolet Optical Telescope (UVOT) (w2, m2 w1 u b v; left) and (right) optical ugBVriz light curves of SN 2024bch. Magnitudes were not corrected for extinction. UV and BV magnitudes were calibrated in the Vega and griz magnitudes in the AB photometric systems. |
By following Anderson et al. (2014) (see also Gutiérrez et al. 2014), we inferred V-band photometric quantities to be compared with those available in the literature (see Table 2). These included the end of the initial steeper decline of the plateau phase, ttran, the mid-point of the plateau to linear decline transition, tPT, the end of the plateau phase, tend, and the corresponding absolute magnitude, Mend (see e.g. Fig. 1 in Anderson et al. 2014). We could identify the two distinct phases of the decline after maximum, which consist of a fast steeper decline, followed by the slower plateau phase with slopes s1 and s2, respectively, while in agreement with Anderson et al. (2014), we referred to the slope of the radioactive tail using the s3 parameter. We computed ttran, tend, and tTP using the mid-points between the last and first epochs of adjacent phases and we estimated their errors adding uncertainties on the explosion epoch and those due to gaps in the light curves (i.e., semi-amplitudes among adjacent phases) in quadrature. When we adopted the most recent redshift-independent distance for NGC 3206 (19.9±4.1 Mpc, which corresponds to a distance modulus μ = 31.49±0.45 mag ; Tully et al. 2016), we inferred a V-band peak absolute magnitude −17.71±0.03 mag (where the uncertainty on the distance modulus of 0.45 mag was not included), with the maximum light occurring at +7.7 days. After maximum, at t < ttran = +44.4±2.0 days, we inferred s1 = 3.41±0.18 mag/100 days by performing 104 Monte Carlo simulations. Mean values and standard deviations of the resulting distributions were taken for s1, s2, and s3 and their uncertainties. At later phases, the light curve evolves more slowly, with a slope s2 = 1.83±0.18 mag/100 days, up to tend = 67.5±1.1 days, which results in a length of the optically thick phase (‘plateau duration’) of Pd = 77.2±4.6 days. Both s1 and s2 are higher than the mean values inferred by Gutiérrez et al. (2014) for their sample of 52 Type II SNe. The derived s2 value is also relatively large if compared to samples of well-studied SNe II (see Arcavi et al. 2012; Sanders et al. 2015; Valenti et al. 2016), in particular to those of Faran et al. (2014a) and Faran et al. (2014b), who set the maximum slope for the plateau phase of Type IIP SNe to ≃ 0.25 mag/100 days. This suggests that SN 2024bch belongs to the linearly declining Type II SNe class. At t ≥ +67.5 days the light curve rapidly drops, with a decline of ≃ 1.7 mag within the following ≃ 25 days. At t ≳ 91 days, the V-band light curve settles on the radioactive tail, with a slope s3 ≃ 1.3 mag/100 days.
V-band light curve parameters of SN 2024bch.
In Fig. 3, we compare the photometric evolution of SN 2024bch to those of a sub-sample of Type II SNe that show high-ionisation lines in their early spectra. Among these, SNe 1998S, 2014G, 2017ahn, 2020pni, 2022jox, and 2023ixf are those that show similar early features over a comparable period after estimated explosion epochs. While the different temperature evolution is highlighted by the u − g colours, we note a remarkable similarity among the g − r and B − V light curves. In addition, the early u − g evolution shows a rapid evolution from relatively red to blue colours within approximately the first 3 days after explosion in all selected objects (see the inset in Fig. 3).
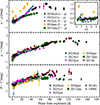 |
Fig. 3. Colour evolution of SN 2024bch compared to those of selected transients that show high-ionisation features in their early spectra. Objects were selected from those with a similar evolution in their main features (including the duration of the narrow features and SN type) with data available in the literature. In the upper panel, the evolution of the U − g colours for SNe 2017ahn, 2020pni, and 2022jox was included, since u-band photometry for these objects was not available. U-band magnitudes for these objects were converted in the AB photometric system adopting the Vega – AB magnitude conversions reported in Blanton & Roweis (2007). In the same panel, the inset includes a zoom-in of the u/U − g early evolution, which shows a rapid decrease in the colours within approximately the first 3 days after explosion for all the selected objects (see the main text). Phases refer to the estimated explosion epochs reported in the literature. Light curves of SN 2023ixf were collected from Li et al. (2024) and Zimmerman et al. (2024). |
3.2. Modelling of the bolometric light curve
The bolometric light curve was inferred by fitting a blackbody to the spectral energy distribution (SED) computed at each epoch, which provided estimates of the photospheric radius, temperature, and corresponding luminosity. At early epochs with available UV data (t < +25 days ), we interpolated light curves at the epochs of the UV photometry, while at later times the interpolation was performed with respect to the r-band light curve (the best sampled one). To avoid extrapolation, UV fluxes beyond +25 days were exluded; however, UV fluxes estimated from the blackbody fit were incorporated into luminosity calculations via the Stefan-Boltzmann law. The SEDs were inferred by adopting zero points and λeff reported in the Spanish Virtual Observatory (SVO7; Rodrigo et al. 2012; Rodrigo & Solano 2020) database, which refers to values in the AB or Vega systems, according to the calibration adopted for each filter (see Section 2). The resulting photometry was corrected for a Galactic reddening E(B−V) = 0.013 mag (Schlafly & Finkbeiner 2011), considering a negligible contribution of the local environment to the total reddening, as we did not detect NaID absorption features at the host redshift in the SN spectra. The resulting evolution of temperature, radius, and bolometric luminosity assuming a distance of 19.9±4.1 Mpc is reported in Table 3. The evolution of both the photospheric temperature and radius already suggests the presence of a relatively low-mass ejected shell that rapidly cools down, and little or no contribution from alternative sources of energy, such as efficient conversion of kinetic energy into radiation through shocks (see Fig. 4). To explore this scenario, we tried to reproduce the bolometric light curve of SN 2024bch using the model provided by Nagy & Vinkó (2016). In this model, the light curve results from the contribution of two distinct regions: a massive ‘bulk’ of ejecta surrounded by a less massive envelope (see also Salmaso et al. 2023). The model assumes homologous expansion of the ejecta, spherical symmetry, and constant opacity (0.34, cm2 g−1 for a H–rich medium with solar composition; Rybicki & Lightman 1986; Lodders 2019). Radiation transport is treated using the diffusion approximation, and the bolometric luminosity is only powered by radiation generated from 56Ni radioactive decay, energy released during gas expansion and cooling, and H recombination (see Arnett & Fu 1989; Nagy et al. 2014). Nagy & Vinkó (2016) further assume a density structure for the supernova ejecta that consists of an inner region with constant density up to a dimensionless radius x0, and an outer region characterised by either an exponential or power-law density profile. Furthermore, they report that a constant density profile for the outer H–rich envelope is particularly effective in fitting the plateau phase of many Type II SNe, which is consistent with the prescription of Arnett & Fu (1989). For our analysis, we employed both a flat (constant) density profile and a power-law profile (ρ ∝ r−2) for the outer region (see e.g. Moriya et al. 2011), noting that this choice minimally affects the overall fit and only influences the derived envelope mass. Following the formalism reported in Chatzopoulos et al. (2012) (see their Eq. 4), we also introduced an additional diffusion time term (tCSM), which simulates the presence of an optically thick CSM along the line of sight. Although observational evidence suggests the need for a ‘detached’ CSM (e.g. early high-ionisation features and the observed rise in the bolometric light curve), we note that this component does not add a further powering mechanism (see also Valerin et al. 2025): no extra energy is provided by ejecta-CSM interaction. We found that the early, sharp peak of SN 2024bch is compatible with the energy radiated by a 0.2 M⊙ cooling envelope characterised by a low diffusion time. The longer-lasting plateau phase is well constrained if we adopt 5 M⊙ of ejecta containing 4.3 × 10⁻² M⊙ of 56Ni. Although this value does not take into account incomplete γ-ray trapping, it is comparable to the one discussed later in this section that results from a more accurate analysis of the late light curve. This is also similar to the mean value of 0.037 ± 0.005 M⊙ found by Rodríguez et al. (2021) for their sample of 109 Type II SNe. The velocities adopted for both the bulk and the envelope are ≃7500 km s−1, which is comparable to the ejecta velocities derived from the spectral analysis (see Section 3.3). This is of paramount importance given the partial degeneracy between the model parameters (e.g. a larger vej would give a larger Mej). Velocity measurements from the minima of the P-Cygni features allow us to constrain the characteristic velocity of the gas, thereby enabling a more reliable estimate of the ejected mass. In Fig. 5, the resulting model is compared to the observed bolometric luminosity of SN 2024bch, while the parameters used are reported in Table 4. The best model was obtained by generating a grid of over 50 models and selecting the one with the lowest root mean square error with respect to the observed data.
Parameters of the blackbody fit to the SEDs of SN 2024bch.
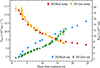 |
Fig. 4. Evolution of the radius and temperature inferred from the blacbody fit to the early SED of SN 2024bch compared to those of SN 2012aw (Dall’Ora et al. 2014) computed using the same approach. |
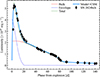 |
Fig. 5. Evolution of the bolometric luminosity of SN 2024bch along with the model used to reproduce the observed data. Dashed lines represent the luminosity contribution from both the envelope and the bulk of the ejecta. The solid green line is the sum of the two components, while the solid light blue line shows the contribution of the extra diffusion time introduced by the CSM. |
At t ≳ +85 days the bolometric light curve settles on the radioactive tail, where the luminosity output is dominated by deposition and re-emission of the γ-rays produced in the reaction chain 56Ni → 56Co → {56Fe. With an e-folding time of 8.8 days, the 56Ni to 56Co decay releases energy during the early phase of the light curve. Its luminosity contribution is delayed by the diffusion time within the bulk of the ejecta and mixed with the emission of the surrounding cooling gas. Instead, 56Co has a much longer lifetime (111.4 days ; Nadyozhin 1994; Junde 1999), and the last part of the radioactive chain is therefore expected to shape the late light curves of CC SNe, after the end of the recombination-dominated phase. The predicted luminosity output during the 56Co -decay phase is given by
 (1)
(1)
Equation (1) assumes full trapping of the γ-rays produced during the decays and instantaneous re-emission of the deposited energy (Jerkstrand et al. 2012). The late evolution of SN 2024bch, on the other hand, slightly deviates from that expected by Eq. (1) and seems to evolve faster (see Fig. 6). A similar behaviour was observed in the stripped-envelope (SE) SNe 1983N, 1983V, and 1993J (Clocchiatti et al. 1996, 1997; Richmond et al. 1994) and, more recently, in the linearly declining Type II SNe 2014G and 2017ahn (Terreran et al. 2016; Tartaglia et al. 2021, both show a spectro-photometric evolution similar to SN 2024bch) and attributed to incomplete trapping of γ-rays produced in radioactive decays. Following Clocchiatti & Wheeler (1997), we then included the additional term
 (2)
(2)
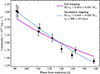 |
Fig. 6. Evolution of the late bolometric luminosity of SN 2024bch with respect to the r-band light curve (see the main text), including the fit on the radioactive tail. The fit assuming full γ-ray trapping is also reported. |
where L0 is given by Eq. (1) and τ0 is a full-trapping characteristic timescale that can be expressed as
 (3)
(3)
with Mej and Ek being the mass and kinetic energy of the SN ejecta, respectively, κγγ-ray opacity, and C a constant that can be expressed analytically by C = (δ − 3)2[8π(δ−1)(δ−5)]−1 for a radioactive medium with a density profile ρ(r, t)∝rδ(t). Fitting Eq. (2) to the late light curve of SN 2024bch, we inferred a 56Ni mass of 0.048 ± 0.003 M⊙ and τ0 = 200±50 days, where values and uncertainties were obtained by performing 104 Monte Carlo simulations. Assuming a typical Ek of 1051 erg, κγ = 0.06 cm2 g−1 (Morozova et al. 2015) and δ = 0, including τ0 ≃ 200 days in Eq. (3) then gives a Mej ≃ 4.5 M⊙. Both M56Ni and Mej are in agreement with the masses predicted by our simple model described above (0.043 and 5.2 M⊙; see Table 4). The derived 56Ni mass, in particular, is very similar to the Ni mass found for the Type II SN 2022jox (0.04 M⊙; Andrews et al. 2024) and is consistent with mean values inferred by statistical studies on CC SNe (see the discussion above).
3.3. Spectroscopic evolution
Early spectra (t ≳ +1.4 days ; see Fig. 7) show narrow emission lines over a blue continuum (T ≳ 1.8 × 10⁴ K), similar to those observed in H-rich interacting SNe (SNe IIn; Schlegel 1990; Smith 2017), with broad wings due to electron scattering occurring in a dense, relatively slow-moving CSM (see Chugai 2001; Huang & Chevalier 2018). The most prominent features are H Balmer lines (Hα, Hβ, Hγ, and Hδ), He IIλ4686, N IIIλ4641, as well as the C IV doublet λλ5801, 5812. The presence of N IIIλ4641 also suggests that λ4103 likely contaminates the flux of Hγ. At +2.4 days we also identify a faint feature that corresponds to He IIλ5412. This is the only transition of the He II Pickering-Fowler series (Osterbrock & Ferland 2006) that does not form a blend with H Balmer lines, which suggests that He IIλ6560, λ4859, and λ4339 also contribute to the fluxes of Hα, Hβ and Hγ, respectively. The signal–to–noise ratio (S/N) of spectra obtained at +1.40 and +1.42 days is not sufficient to rule out the presence of this feature at earlier phases as well.
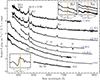 |
Fig. 7. Early spectroscopic evolution of SN 2024bch (up to +16 days ). Spectra were not corrected for Galactic extinction along the line of sight. The circle with cross, ⊕, symbols mark the position of the main telluric features. Zoom-in panels show the Hβ and He I/NaID regions (at +7 and +8 days for Hβ, and +7, +8, and +16 days for NaID) and Hα, with expansion velocities referred to the rest-frame wavelengths marked with vertical yellow lines. Rest-frame phases refer to the estimated explosion epoch. |
In Fig. 8, we also compare the Hα region in the medium resolution spectrum of SN 2024bch (R ∼ 3500) obtained at +3.51 days with the one obtained at a similar epoch for SN 1998S (Shivvers et al. 2015). SN 2024bch shows a similar profile, with broad wings due to electron scattering in the unshocked circumstellar material, which also emits other narrow high-ionisation features visible up to ≃ {+}8 days. Although broad wings in relatively narrow emission lines (as in the case of Type IIn SNe) have often been interpreted as an additional emission component from underlying fast-moving SN ejecta or shocked regions (see e.g. Turatto et al. 1993), Chugai (2001) showed that multiple scattering of photons by free electrons is able to reproduce the whole line profile in SN 1998S without invoking additional components (see also Huang & Chevalier 2018, for a more recent discussion on the process), adopting a Thomson optical depth of the shell of at least τ ∼ 3 − 4 at this epoch (for an electron temperature Te ≃ (2.5−3.0) × 104 K ). Based on the remarkable similarities between the two objects, we can therefore assume a similar optical depth for the circumstellar environment of SN 2024bch. To further investigate the similarities between the two transients, we compare their spectroscopic evolution up to ≃ 140 days in Fig. 9. SN 2024bch exhibits a more rapid evolution, with high-ionisation features disappearing within the first ≃ 8 days. The spectro-photometric evolution of SN 1998S was succesfully reproduced by Dessart et al. (2016) through radiation hydrodynamics and radiative transfer modelling, based on a scenario where the explosion occurred within a dense medium and a significant fraction of the SN luminosity is powered by ejecta-CSM interaction. In their ‘model A’, typical SN ejecta (∼10 M⊙, with an Ek = 1051 erg ) collide with an outer dense shell formed through a wind expanding at vw = 102 km s−1, characterised by a mass loss rate of 0.1 M⊙ yr−1. This intense mass loss episode lasted 3.5 yr and ended ∼ 3 yr before the SN explosion, producing a shell with an inner radius of 1.0 × 1015 cm extending out to 2.1 × 1015 cm, where its density drops sharply, a configuration similar to that proposed by Chugai et al. (2004) for the Type IIn SN 1994W. Figures 9 and 10 show that, although this model is able to reproduce the spectroscopic evolution of both transients (with SN 2024bch showing a faster spectroscopic evolution), it fails to match both the rise and the peak luminosity of SN 2024bch. The faster rise time and fainter bolometric light curve of SN 2024bch reinforce our claim that interaction makes only a marginal, if any, contribution to its luminosity output.
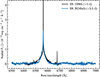 |
Fig. 8. Comparison of the higher-resolution spectrum available (R ∼ 3500) for SN 2024bch obtained ≃ {+}3.5 days with AFOSC with the one of SN 1998S (published by Shivvers et al. 2015) at a similar phase (adopting JD = 2450872.5 as reported by Fassia et al. 2000). |
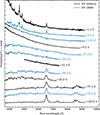 |
Fig. 9. Comparison between the spectroscopic evolution of SN 2024bch and SN 1998S up to ∼ +140 days (spectra from Leonard et al. 2000; Fassia et al. 2001). |
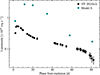 |
Fig. 10. Comparison between the bolometric light curve of SN 2024bch and ‘Model A’ from Dessart et al. (2016), which was built to explain the luminosity evolution of SN 1998S. The model fails to reproduce both the fast rise and the overall luminosity of SN 2024bch, which suggests that ejecta-CSM interaction does not play a role in powering its light curve. |
Narrow high-ionisation lines in early spectra are often attributed to a confined shell of gas expelled during the very late evolutionary stages of the progenitor, which is rapidly overtaken by the expanding SN ejecta. The engine that provides the energetic photons responsible for the ionisation of this gas is typically identified as the conversion of ejecta kinetic energy into radiation, as happens in interacting transients (see Chevalier & Fransson 2003, and references therein). The early evolution of SN 2024bch, on the other hand, does not show clear signatures of ongoing ejecta-CSM interaction, with a rapidly evolving SED that is consistent with a freely expanding photosphere where the contribution of an extra source of energy is not required to model its early bolometric light curve (see Section 3.1). In addition, while in most cases the strength of narrow features progressively declines, in SN 2024bch we note a rapid increase in their integrated luminosity up to ∼ +2.44 days (except for Hα, where the maximum occurs at +3.40 days, which suggests a larger radius for the H-rich region). After maximum, the luminosity of narrow features rapidly declines until t≃ +7 days, when they fade below the continuum level. As discussed in Sect. 3.1, the increase in the flux of narrow lines does not correspond to a similar evolution of the pseudo-continuum temperature, although optical spectra do show an apparent increase in their slope at λ < 5000 Å. The same effect was observed in the early spectra of SN 1998S (see Leonard et al. 2000) and explained by invoking a non-standard extinction law or the presence of dust ‘echoing’ the SN light from earlier epochs. As for SN 1998S, a single blackbody cannot reproduce the spectral continuum at +2.4 days, which would suggest a similar interpretation for SN 2024bch. While a non-standard extinction law seems implausible due to the negligible reddening along the line of sight of SN 2024bch, a light echo may be supported by the peculiar evolution of the narrow lines, as discussed below. We note, on the other hand, that the SED of SN 2024bch is well reproduced by a blackbody if we include fluxes obtained from UV photometry, which rules out the need for a hotter source of energy or a non-standard extinction law. This also highlights the importance of UV data when the peak of the emission is at bluer, or much bluer wavelengths than those covered by optical spectra.
We note all narrow lines are blueshifted, with peaks progressively shifting towards their rest wavelengths. In Hα (the most prominent line) the shift decreases from ≃240 to ≃30 km s−1 up to +3.4 days and similar values are measured from the other emission lines, although these may be affected by the lower S/N and the contamination of other emission features, as discussed above. This is not the expected evolution for an ionised CSM accelerated by SN radiation. Radiative acceleration has already been discussed for other objects (e.g. SNe 2010jl, 2015da and 2023ixf Fransson et al. 2014; Tartaglia et al. 2020; Smith et al. 2023; Zimmerman et al. 2024) and it can be recognised by a progressive increase in the blueshift of the line peaks. Since in SN 2024bch we see the opposite, we can assume a negligible acceleration of the CSM by the SN radiation field. The radius at which radiative acceleration does not efficiently affect the CSM velocity (∼1015 cm for SN 2024bch) may provide a lower limit for the inner CSM radius. In gas shells of this size, light travel time and light echoes become both relevant in shaping the observed spectral features. The evolution of narrow peaks towards their rest wavelengths in SN 2024bch may then be interpreted as the contribution of emitting regions with progressively smaller velocity components along the line of sight. In a CSM geometry similar to that presented by Miller et al. (2010, see e.g. their Fig. 6), at early phases one would detect narrow features emitted by the region closest to Earth, blueshifted by ≃240 km s−1 due to its motion towards the observer. As time progresses, the observer would be reached by photons emitted by more distant regions, with a progressively smaller velocity component along the line of sight. Consequently, at later phases, the emission peaks would be blueshifted by only ≃30 km s−1. This scenario would also explain the luminosity evolution of narrow lines due to the progressive increase in the emitting volume. The luminosity peak would in fact be expected when the emission is dominated by light from the inner shell layers on the opposite side with respect to the observer. This is because we expect the inner part of the shell to be the most affected by the SN light, hence the luminosity of narrow features is likely dominated by photons emitted in this region. In this context, the epoch at which narrow features reach their maximum luminosity can also be used to infer an independent estimate of the inner CSM radius through the light travel time (Rin ≃ c × t/2). Adopting tmax = 3.4 days (the maximum luminosity measured for Hα), we obtained Rin ≃ 4.4 × 1015 cm, in agreement with the lower limit derived above. Typical SN ejecta (i.e. with vej = 104 km s−1) would then reach Rin not earlier than treach ≃ +51 days, +68 days assuming vej ≃ 7500 km s−1 adopted for the bulk of the ejecta in our model (see Section 3.2). These phases are in agreement with the later spectroscopic evolution of SN 2024bch, which at t≃ +69 days shows possible signature ejecta-CSM interaction in terms of a blue boxy component in the Hα profile (see the discussion below and in Section 4). This analysis points towards a distant CSM, reached by the SN ejecta only several weeks after explosion, and highlights the need for a source of ionising photons different from interaction for the early narrow features observed in SN 2024bch.
The Bowen fluorescence mechanism (Bowen 1934, 1935) may explain the presence of high-ionisation lines without involving a significant contribution of ejecta-CSM interaction. This mechanism relies on a fortuitous coincidence in wavelengths that allows the He IIλ303.783 resonance line to populate the O III 2p3d3P2 level, followed by the emission of O IIIλ303.799 (O1 process; see Osterbrock & Ferland 2006). The excited O III can then emit several Bowen lines, including prominent ones at λ3444, λ3133, λ3341, λ3312, λ3047, and λ3760, as well as other extreme ultraviolet lines (see the Grotrian diagrams reported in Kallman & McCray 1980; Selvelli et al. 2007). Notably, O IIIλ374.436 can further excite nitrogen through a resonance doublet at λ374.434 and λ374.441, populating the N III  levels, subsequently decaying to
  and
and  emitting N IIIλ4641, λ4641, and λ4642, respectively, and to the
  level emitting N IIIλ4097 and λ4103 (see Fig. 13 and the discussion in Selvelli et al. 2007). This mechanism was invoked to explain N III lines in a variety of gaseous nebulae, including planetary nebulae, X-ray binaries, symbiotic stars and novae in the early nebular stages (see Kastner & Bhatia 1996), and, more recently, in the tidal disruption events (TDEs) iPTF15af (Blagorodnova et al. 2019) and iPTF16fnl (Onori et al. 2019), and it may be a viable excitation mechanism for SN 2024bch as well. Fransson et al. (2002) used near-UV spectra to quantify the contribution of the Bowen mechanism in the Type IIn SN 1995N through O IIIλ3047, λ3133, λ3340, and λ3444 lines, as well as the I(O IIIλ3132)/I(He IIλ4686) ratio to estimate the Bowen yield for He IIλ304. Unfortunately, our early spectra do not extend below ∼3600 Å (see Table 1 and Fig. 7) and we cannot quantify the Bowen yield using O IIIλ3132. While early spectra of SN 2024bch lack O IIIλ3444 (a key diagnostic of the Bowen mechanism in planetary nebulae as well; see e.g. Weymann & Williams 1969; Liu & Danziger 1993), the presence of N IIIλ4641 and He IIλ4686 in our observations aligns with Galactic X-ray sources (e.g. McClintock et al. 1975). Although these lines can also arise via dielectronic recombination (Mihalas & Hummer 1973), theoretical (e.g. Hatchett et al. 1976) and observational (e.g. Margon & Cohen 1978) evidence strongly supports Bowen fluorescence as the dominant mechanism for amplifying N III emission. Thus, despite the absence of direct UV diagnostics, the observed spectral features suggest that Bowen fluorescence remains a viable explanation for SN 2024bch.
At t > + days, spectra are dominated by a blue (T ≃ 1.3 × 10⁴ K), almost featureless continuum typically observed during the early phases of Type II SNe. The persistence of a narrow Hα line with an absorption component visible at +7 and up to +16 days, on the other hand, suggests the presence of a H-rich unshocked shell with a blue-velocity-at-zero-intensity (BVZI) ≃300 km s−1 and a photospheric velocity ≃150 km s−1 (as measured from the highest resolution spectrum available at these phases, obtained at +16 days); see the inset in Figure 7. Adopting the Rin derived above and BVZI for the expansion velocity of the CSM, this would date the mass-loss event producing the outer shell to approximately 5 years before the SN explosion.
At +42 days, spectra show a significant metamorphosis, as broad P Cygni features begin to shape the spectral continuum. We identify broad absorption features that correspond to H Balmer lines (Hβ, Hγ and Hδ), He I/NaID and O I (from +48 days; see Fig. 11). The blue part of the continuum is also shaped by several features that correspond to the Fe-group elements, such as Fe II (multiplet 42), Sc II (multiplets 28 and 29), and Ba IIλ6142, where multiplets numbers are given following the notation reported in Moore (1945). At +48 days, we also identify broad features that correspond to the Ca II near infrared 8498, 8542, 8662 Å triplet, O Iλ8446, and O I 7772 − 7775, although we cannot rule out their presence at earlier phases due to the limited spectral coverage of previous data. From the minima of Hβ and NaID at +42 days, we estimate photospheric expansion velocities for the outer ejecta layers of 6745 ± 760 km s−1 and 6830 ± 740 km s−1, respectively, with uncertainties computed as in Gutiérrez et al. (2017). Both values are higher than those typically observed in Type II SNe at similar phases (see Gutiérrez et al. 2017). At +108 days the estimated expansion velocities are 3440 ± 750 and 4600 ± 250 km s−1 for Hβ and NaID, respectively, still above the average values inferred by Gutiérrez et al. (2017). During the same period, emission peaks (e.g. Hα, Hβ) progressively shift towards the corresponding rest wavelengths (see panels 2 and 3 in Figure 11). As it is believed to form closer to the SN photosphere, another estimate of the photospheric expansion velocity can be inferred from the P Cygni profiles of the Fe II 42 multiplet, in particular the relatively isolated λ5169 line (see e.g. the discussion in Dessart & Hillier 2006). This gives an expansion velocity of 5210 ± 740 km s−1 at +42 days, which declines to 3900 ± 300 km s−1 at +108 days. These are both significantly above the mean velocities inferred by Gutiérrez et al. (2017) for their sample of Type II SNe at similar phases (3760 ± 1045 km s−1 at t≃ +42 days and 2625 ± 457 km s−1 at t≃ +108 days).
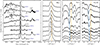 |
Fig. 11. From left to right: Optical spectroscopic evolution of SN 2024bch at t≥ +42 days (Panel 1; along with the identification of the most prominent spectral features), evolution of the Hα profile (panel 2), Hβ (panel 3), and NaIDPanel 4 features in the velocity plane at the same epochs. Yellow lines correspond to the rest-frame wavelengths, while blue lines mark the evolution of the P Cygni absorption minima. Phases refer to the estimated explosion epoch. |
3.4. Early nebular spectra
Forbidden [CaII]λλ7291, 7324 emerge at t≳ 75 days, although we cannot rule out their presence at earlier phases due to the limited wavelength coverage of the +69 days spectrum. Several forbidden lines may contribute to the flux in the 7000 − 7600 Å spectral region, including [FeII] and stable [NiII]. At +154 days, [CaII]λλ7291, 7323 shows a strongly asymmetric profile where [FeII]λ7155 likely contributes to the blue part of the emission, while [NiII]λ7378 and λ7412 and [FeII]λ7453 shape the red tail of the emission feature. Jerkstrand et al. (2015) and Terreran et al. (2016) modelled the similar feature observed in SNe 2012ec and 2014G by adopting a multi-Gaussian fit to the entire region, and considered the contribution of [CaII]λλ7291, 7323, [FeII]λ7155, λ7172, λ7388, λ7453, and [NiII]λ7378 and λ7412 to the overall profile. Since we were unable to reproduce the overall spectral feature using the aforementioned lines, even letting the line ratios vary within reasonable ranges, we had to include two additional emissions around ∼7050 and ∼7450 Å. Although we tentatively identified the blue excess as He Iλ7065, we could not find a reasonable identification for the red feature. We therefore fixed the wavelength of the blue component and allowed the red one to vary within our fitting procedure. In addition, to minimise the number of free parameters, we also ignored the contributions of [FeII]λ7172 and λ7388, which are relatively faint with respect to the other components in the reference model (L7172/L7155 = 0.24 and L7388/L7172 = 0.74; see Jerkstrand et al. 2014, 2015). Our ‘best-fit’ model is shown in Fig. 12, where we found the red extra component to be centred at λ7471 with a luminosity (2.03 ± 0.84)×1038 erg s−1, while for He Iλ7065 we derived (3.0 ± 1.2)×1038 erg s−1, which corresponds to L7471L7155 ≃ 0.6 and L7065L7155 ≃ 0.8. Following Jerkstrand et al. (2014), we fixed the luminosity ratios of lines coming from the same levels, such as L7453/L7155 = 0.31, and, as in Jerkstrand et al. (2015), we also assumed L7412/L7378 = 0.31. When we allowed the blueshift and FWHM of the emission lines to vary (while forcing it to the same value for all lines), we inferred: L7155 = (3.4 ± 1.4)×1038 erg s−1, L7453 = (1.05 ± 0.43)×1038 erg s−1, L7378 = (6.0 ± 2.5)×1038 erg s−1, and L7412 = (1.87 ± 0.77)×1037 erg s−1, assuming L7291 = L7323 = (1.15 ± 0.47)×1039 erg s−1, where we considered a distance of 19.9±4.1 Mpc and errors are dominated by its uncertainty (∼50% of the total uncertainty). The fitting procedure also provided a rigid shift Δλ = 20.10 ± 0.52 Å (≃830 km s−1 with respect to 7250 Å, the centre of the spectral region considered) and a FWHM velocity of 3332 ± 45 km s−1, both assumed to be constant for all lines (as in Terreran et al. 2016).
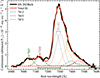 |
Fig. 12. Multi-Gaussian fit to the spectral region around [CaII]λλ7291, 7324, following the prescriptions of Jerkstrand et al. (2015) and Terreran et al. (2016). The fit was performed on the spectrum obtained at +154 days. |
Although the reference model was specifically designed for SN 2012aw (see Jerkstrand et al. 2014, for details) and assumes local thermodynamic equilibrium (LTE) and that all lines are optically thin, it is capable of reproducing the observed spectral region between 6900 and 7600 Å of SN 2024bch as well, although we had to include two additional features (He Iλ7065 and λ7471). On the other hand, we note that a red excess with respect to the same model was also observed in the [CaII] region of SNe 2012ec and 2014G (Jerkstrand et al. 2015; Terreran et al. 2016, respectively), so the red feature we find at λ7471 is likely to be real. The luminosity ratio of the [NiII]λ7378 and [FeII]λ7155 lines can be used to estimate iron and nickel abundances, which, in LTE and assuming optically thin emission, can be expressed as
 (4)
(4)
where we used a ratio between partition functions ZNi II/ZFe II = 0.25, statistical weights  and
and  , and transition probabilities A7378 = 0.23 s−1 and A7155 = 0.146 s−1, as in Jerkstrand et al. (2015). Although we lack evidence that supports LTE at these phases, this ratio is relatively insensitive to temperature and density, which implies that deviations from LTE would similarly affect both lines. However, we note that the fit of the [CaII] region accurately reproduces the overall shape of its spectral region, which suggests that large deviations from LTE are unlikely. In addition, as shown by Jerkstrand et al. (2017), modelling of commonly observed SN lines suggests that the assumption of LTE may hold for [CaII]λλ7291, 7324, [FeII]λ7155, and [NiII]λ7378 up to ∼ 280{-}350 days after explosion. Moreover, the assumption of optically thin emission may be reasonable at +154 days (e.g. see the typical tthin reported there for [NiII]). Assuming Ni II/Fe II ≃ Ni/Fe, Eq. (4) then gives the Ni/Fe production rate as a function of temperature. If all 56Ni decayed and most of 56Co decayed into 56Fe (≃65% at +154 days, assuming e-folding times of 8.8 and 111.4 days for 56Ni and 56Co, respectively), the Fe-zone temperature can be determined comparing the measured L7155/M56Ni to the theoretical value
 (5)
(5)
where we adopted a partition function ZFe II = 15 + 0.006T as in Jerkstrand et al. (2015). The resulting temperature is  , where, in comparing the two sides of Eq. (5), we took into account the uncertainties on the derived L7155 and M56Ni (see Sect. 3.1), but we did not consider possible contamination by primordial Fe and Ni (see e.g. Maguire et al. 2012), which may lead to an underestimation of the derived Ni II/Fe II ratio. This temperature gives a Ni II/Fe II = 0.16±0.06, ≲3 times higher than the solar value of 0.056 (Lodders 2003), which is in agreement with the values found for SNe 2012ec (0.19 ± 0.07) and 2014G (0.18 ± 0.02) by Jerkstrand et al. (2015) and Terreran et al. (2016), respectively. This is also higher than typical values found for other CC SNe, although the number of objects with estimated Ni II/Fe II is still relatively small (see Rank et al. 1988; MacAlpine et al. 1989, 2007; Wooden et al. 1993; Jerkstrand et al. 2012, 2015).
At t≥ 107 days, [OI]λλ6300, 6364 and 5577 emerge, progressively increasing their strength with respect to the local continuum. At +154 days, the total luminosity of the λλ6300, 6364 doublet is ≃1.4 × 1039 erg s−1, while the luminosity ratio is ∼1, which suggests optically thick emission. While both lines are clearly visible, a fit to the overall profile is complicated by the complex region around the doublet, where the level of the continuum cannot be determined easily. [OI]λ5577 is usually weak in CC SNe, although we clearly detect the line in the early nebular phase of SN 2024bch. In order to avoid contamination from nearby emission features, Jerkstrand et al. (2014) fit the overall profile including the contribution of [FeII]λ5528. Following the same approach, we found a two-component Gaussian fit is able to reproduce the entire emission feature at +154 days, corresponding to [FeII]λ5528 and [OI]λ5577 both with a blueshift comparable to the one measured from the multi-Gaussian fit to the 7000 − 7600 spectral region (20.10 ± 0.52 Å; see above). The derived luminosity L5577 ≃ 3.0 × 1038 erg s−1 can be used, along with the estimate of L6300, 6364 mentioned above, to derive the temperature of the emitting region. In LTE,
 (6)
(6)
where β5577 and β6300, 6364 are the photon escape probabilities in the Sobolev approximation (βλ = (1 − e−τλ)/τλ; Sobolev 1957). When the [OI] doublet transitions to optically thin conditions, the relative intensities approach their intrinsic ratio of 3:1 since both transitions share the same upper energy level. In approaching the optically thin regime (i.e. τ ≲ 1 and [OI]λ6300 stronger than [OI] 6364), β6300, 6364 becomes ≳0.6. This is not the case for SN 2024bch at +154 days, where the doublet is still in the optically thick regime. On the other hand, if we assume similar temperatures for the Fe– and O–rich zones (≃ 3946 K, as derived above), we can use Eq. (6) to estimate the escape probabilities ratio, resulting in β5577/β6300, 6364 ≃ 3.85. The dependence of the O mass on the photon escape probabilities is represented in Fig. 13.
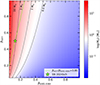 |
Fig. 13. Colour map showing the dependence of the O mass on the escape probabilities β6300, 6363 and β5577, according to Eqs. (6) and (7). Dashed black lines trace the location of some relevant O mass values. The solid green line displays the constant β5577/β6300, 6363 ratio found through Eq. (6). The position of SN 2024bch in this plane, based on the measurements performed on the spectrum at +154 days, is marked with a green star. |
The oxygen yield of the explosion can be derived using
 (7)
(7)
where we adopted the atomic constants reported in Jerkstrand et al. (2014). Substituting the measured L6300, 6364 in Eq. (7) gives  assuming a similar temperature for the Fe– and O–rich zones. As an example, the photospheric temperature at +158 days inferred in Sect. 3.1 (i.e. if we consider the O–rich zone to be closer to the photosphere than the Fe–rich zone), would give
  . Assuming β6300, 6364 = 0.32 (equivalent to τ6300, 6364 ≃ 3) would give MO I ≃ 0.8−1.4 M⊙, consistent with a MZAMS = 15 − 20 M⊙ according to Nomoto et al. (1997) and Rauscher et al. (2002). However, these estimates are heavily affected by the assumptions made, including the temperature of the emitting region, the value of β6300, 6364, and the optical thickness of the [OI]λλ6300, 6364 doublet at +154 days. One of the most important sources of uncertainty is the assumed temperature of the O-rich region, reflected in Equation 7, which, in our case, is supported by neither observational nor theoretical considerations. As seen in Sect. 3.4, an uncertainty of only ∼ 400 K (the difference between TFe and Tph at +158 days) translates to roughly a factor of two uncertainty in the derived oxygen mass, spanning from
  to
to  . Later spectra (e.g. when the transition to the optically thin regime occurs; see Valerin et al. in preparation) will provide more precise constraints and enable a comparison with these preliminary estimates.
4. Summary and conclusions
In the previous sections we have detailed our analysis of the photometric (Sect. 3.1) and spectroscopic (Sect. 3.3) evolution of the Type II SN 2024bch. Early spectra (t ≲ + 7 days) are dominated by narrow emission lines such as He II, N III, and C IV in addition to those of the H Balmer series (from Hα to Hδ). These show broad wings due to Thomson scattering by free electrons in a dense CSM (see e.g. Chugai 2001; Huang & Chevalier 2018, and the comparison with the Hα profile of SN 1998S at sufficiently high resolution in Fig. 8) with an integrated luminosity that increases up to a maximum occurring ≃ 2−3 days after explosion for all narrow lines. As narrow lines increase in strength, their peaks progressively shift towards their rest wavelengths. We interpreted this evolution as a geometrical effect of the emitting region, in a similar fashion to a light echo (see the geometry described for SN 2006gy in Fig. 6 by Miller et al. 2010, and Figure 14). At the time of the Hα maximum luminosity (≃ +3.4 days), we inferred the inner radius of the H-rich circumstellar shell by only considering the light travel time, which resulted in an inner radius Rin ≈ 4.4 × 1015 cm. This can be reached by typical SN ejecta (with vej ≃ 104 km s−1; consistent with the BVZI measured from the Hβ P Cygni profile) not earlier than treach ≃ 51 days, which corresponds to the appearance of a blue shoulder in the Hα line profile, occurring at t≳ +69 days. It is therefore unlikely that the disappearance of narrow high-ionisation emission lines at ≃ +7 days (see Fig 7) is due to the CSM being swept away by the SN ejecta. In addition, the contribution of CSM-ejecta interaction to the luminosity output of the transient could be marginal and it is not necessary to reproduce the observed data of SN 2024bch, as shown by the modelling of its bolometric light curve (see Sect. 3.1 and Figure 5). Our ‘best-fit’ model is able to reproduce the entire evolution of the bolometric luminosity invoking the contribution of two regions: a bulk of relatively massive ejecta (Mbulk = 5 M⊙), whose emission accounts for the plateau luminosity, and an extended envelope (Menv = 0.2 M⊙) with an outer radius Renv = 7 × 1013 cm, which is responsible for the early luminosity peak due to its short diffusion time. This challenges the most common scenario invoked for SNe displaying ‘flash spectroscopy features’ (Gal-Yam et al. 2014), where shocks are the main source of ionising photons behind high-ionisation features.
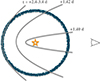 |
Fig. 14. Schematic view, not to scale, of the preferred geometrical configuration for the CSM of SN 2024bch. An outer shell with Rin ≳ 4.4 1015 cm} is reached by radiation at different times and emits high-ionisation features through the Bowen fluorescence mechanism. This scenario can simultaneously explain the evolution of the luminosities and redshifts of narrow features without the need for ejecta-CSM interaction as an additional source of energy. |
Narrow high-ionisation features may instead be the result of fluorescence due to efficient absorption of extreme early UV radiation and subsequent resonance due to the nearly coincident wavelengths of He II, OIII, and N III transitions. H Balmer (and possibly He IIλ4686 and C IV) lines may instead be interpreted as recombination features following the photo-ionisation of the CSM by the SN shock breakout, possibly extended by the presence of an inflated envelope (see e.g. Moriya et al. 2015). All these features are typically observed in a significant fraction of CC SNe with sufficiently early spectra (see Bruch et al. 2021) and this alternative scenario may be relevant in interpreting their early evolution. In this context, narrow emission lines in SN spectra only prove the presence of an outer CSM and are not related to ‘efficient’ interaction (see e.g. Salmaso et al. 2023, for a definition of ‘strongly interacting’ SNe). This also has important implications for multi-messenger astronomy, as strongly interacting SNe may provide a viable source of neutrinos in an energy range comparable to those detected by IceCube (up to 1 Pev; see Fang et al. 2020; Pitik et al. 2023). A lack of ‘early interaction’ may also explain the non-detection of some SNe II with high-ionisation features at radio wavelengths at early times (see e.g. Tartaglia et al. 2021).
Possible signatures of CSM interaction appear at t ≲ +69 days, in terms of a blue ‘shoulder’ visible in the Hα emission profile (see Figure 11). However, according to the photometric analysis, this neither contributes significantly to the total energy output of the transient, nor causes a significant change in the ionisation state of the emitting region. Alternatively, a flat-topped boxy profile may be produced by a recombining H-rich inner shell visible at later times after the SN photosphere recedes (see e.g. Wagenblast et al. 1983; Bertout & Magnan 1987, for an analytical discussion on possible line profiles emitted by expanding spherical shells). This shell should contain a relatively small mass of H in order to account for the shape of the light curve, which at +85 days already settles on the radioactive decay tail. In any case, the interaction of fast SN ejecta with the pre-existing CSM, if present at all, does not seem to contribute significantly to the total energy output of the transient at any phase. While the negligible contribution of interaction at early phases can be explained invoking Bowen fluorescence powering narrow lines at t ≲ +7 days, which shows that the lack of a significant extra source of energy at later phases is non-trivial and may involve a complex geometry or CSM structure. The presence of a ‘clumpy’ CSM was discussed by Chugai & Danziger (1994) to explain the multi-component emission lines observed in SN 1988Z and similar and/or asymmetric structures seem to be common in eruptive and explosive transients (see e.g. Smith et al. 2001; Kamiński et al. 2021), while a peculiar geometry was invoked to explain ‘hidden interaction’ in PTF11iqb, iPTF14hls, and SN 2020faa (see e.g. Smith et al. 2015; Salmaso et al. 2023). The dataset collected so far does not allow us to further constrain the physical and geometrical properties of the SN explosion and its circumstellar environment.
Modelling of the radioactive tail (i.e. at t≳ +90 days; see Fig. 6) reveals a non-complete trapping of the γ-rays produced in the 56Ni → 56Fe decay and results in a mass of radioactive Ni produced in the explosion of ≃0.048 M⊙. If we include information provided by early nebular emission features and assume τ ≃ 3 for the O–rich region, this results in a mass of synthesised O of 0.8 − 1.4 M⊙, which, according to the nucleosynthesis yields computed by Nomoto et al. (1997) and Rauscher et al. (2002), corresponds to a MZAMS = 15 − 20 M⊙ progenitor. This estimate is strongly limited by the estimated temperature of the O–rich region and the optical thickness of the [OI]λλ6300, 6364 doublet at +154 days, which is the last available spectroscopic epoch before the end of the transient visibility window and will be refined with proper spectroscopic data once the transient is visible again.
Modelling of the bolometric light curve along with our analysis of spectroscopic data suggest that SN 2024bch exploded and expelled a moderate amount of H-rich gas (≲6 M⊙) within an extended (Rin ≃ 4.4 × 1015 cm) and likely massive shell of CSM. The presence of this outer CSM, along with the estimated MZAMS for the progenitor and ejected mass from our modelling, support the claim that fast-evolving Type II SNe are produced by massive stars that lose a significant fraction of their outer H-rich layers before explosion.
Data Availability
Table 3 and data shown in Figures 2, 7, 8 and 11 are available at the CDS via https://cdsarc.cds.unistra.fr/viz-bin/cat/J/A+A/703/A177
Acknowledgments
We thank Elena Mason for the useful and lively discussions. G. V., A. P., I. S., S. B. L. Tom. and P. O. acknowledge support from the PRIN-INAF 2022 project “Shedding light on the nature of gap transients: from the observations to the model”. F. O. acknowledges support from MIUR, PRIN 2020 (grant 2020KB33TP) “Multimessenger astronomy in the Einstein Telescope Era (METE)” and from INAF-MINIGRANT (2023): “SeaTiDE - Searching for Tidal Disruption Events with ZTF: the Tidal Disruption Event population in the era of wide field surveys”. A. R. also acknowledges financial support from the GRAWITA Large Program Grant (PI P. D’Avanzo). This research made use of the Spanish Virtual Observatory (https://svo.cab.inta-csic.es) project, funded by MCIN/AEI/10.13039/501100011033/ through grant PID2020-112949GB-I00, the NASA/IPAC Extragalactic Database (NED), funded by the National Aeronautics and Space Administration and operated by the California Institute of Technology and the HyperLeda database (http://leda.univ-lyon1.fr). The ZTF forced-photometry service was funded under the Heising-Simons Foundation grant #12540303 (PI: Graham). Based on observations collected with the Copernico and Schmidt telescopes (Asiago, Italy) of the INAF – Osservatorio Astronomico di Padova and the Wide-field Optical Telescope (WOT), a 67/91 cm Schmidt telescope equipped with an Apogee Aspen CG16M camera located at the Campo Imperatore observatory in l’Aquila (Italy) of the INAF – Osservatorio Astronomico d’Abruzzo. This article is also based on observations made in the Observatorios de Canarias del IAC with the Telescopio Nazionale Galileo, operated on the island of La Palma by INAF at the Observatorio del Roque de los Muchachos under the A47TAC_37 (PI: G. Valerin) and A49TAC_64 (PI: L. Tartaglia) programmes.
References
- Abdurro’uf, A., Accetta, K., Aerts, C., et al. 2022, ApJS, 259, 35 [NASA ADS] [CrossRef] [Google Scholar]
- Anderson, J. P., González-Gaitán, S., Hamuy, M., et al. 2014, ApJ, 786, 67 [Google Scholar]
- Andrews, J. E., Pearson, J., Hosseinzadeh, G., et al. 2024, ApJ, 965, 85 [CrossRef] [Google Scholar]
- Arcavi, I., Gal-Yam, A., Cenko, S. B., et al. 2012, ApJ, 756, L30 [NASA ADS] [CrossRef] [Google Scholar]
- Arnett, W. D., & Fu, A. 1989, ApJ, 340, 396 [NASA ADS] [CrossRef] [Google Scholar]
- Balberg, S., & Loeb, A. 2011, MNRAS, 414, 1715 [NASA ADS] [CrossRef] [Google Scholar]
- Balcon, C. 2024, Trans. Name Server Class. Rep., 2024-284, 1 [Google Scholar]
- Bellm, E. C., Kulkarni, S. R., Graham, M. J., et al. 2019, PASP, 131, 018002 [Google Scholar]
- Bertout, C., & Magnan, C. 1987, A&A, 183, 319 [NASA ADS] [Google Scholar]
- Blagorodnova, N., Cenko, S. B., Kulkarni, S. R., et al. 2019, ApJ, 873, 92 [NASA ADS] [CrossRef] [Google Scholar]
- Blanton, M. R., & Roweis, S. 2007, AJ, 133, 734 [NASA ADS] [CrossRef] [Google Scholar]
- Blinnikov, S. 2017, in Handbook of Supernovae, eds. A. W. Alsabti, & P. Murdin (Springer Reference), 843 [Google Scholar]
- Blinnikov, S. I., & Bartunov, O. S. 1993, A&A, 273, 106 [NASA ADS] [Google Scholar]
- Bowen, I. S. 1934, PASP, 46, 186 [Google Scholar]
- Bowen, I. S. 1935, ApJ, 81, 1 [NASA ADS] [CrossRef] [Google Scholar]
- Brown, P. J., Holland, S. T., Immler, S., et al. 2009, AJ, 137, 4517 [NASA ADS] [CrossRef] [Google Scholar]
- Bruch, R. J., Gal-Yam, A., Schulze, S., et al. 2021, ApJ, 912, 46 [NASA ADS] [CrossRef] [Google Scholar]
- Bruch, R. J., Gal-Yam, A., Yaron, O., et al. 2023, ApJ, 952, 119 [NASA ADS] [CrossRef] [Google Scholar]
- Chambers, K. C., Magnier, E. A., Metcalfe, N., et al. 2016, arXiv e-prints [arXiv:1612.05560] [Google Scholar]
- Chatzopoulos, E., Wheeler, J. C., & Vinko, J. 2012, ApJ, 746, 121 [Google Scholar]
- Chevalier, R. A., & Fransson, C. 1994, ApJ, 420, 268 [NASA ADS] [CrossRef] [Google Scholar]
- Chevalier, R. A., & Fransson, C. 2003, in Supernovae and Gamma-Ray Bursters, ed. K. Weiler (Berlin, Heidelberg: Springer), 598, 171 [NASA ADS] [CrossRef] [Google Scholar]
- Chugai, N. N. 2001, MNRAS, 326, 1448 [NASA ADS] [CrossRef] [Google Scholar]
- Chugai, N. N., & Danziger, I. J. 1994, MNRAS, 268, 173 [NASA ADS] [Google Scholar]
- Chugai, N. N., Blinnikov, S. I., Cumming, R. J., et al. 2004, MNRAS, 352, 1213 [NASA ADS] [CrossRef] [Google Scholar]
- Clocchiatti, A., & Wheeler, J. C. 1997, ApJ, 491, 375 [Google Scholar]
- Clocchiatti, A., Wheeler, J. C., Benetti, S., & Frueh, M. 1996, ApJ, 459, 547 [Google Scholar]
- Clocchiatti, A., Wheeler, J. C., Phillips, M. M., et al. 1997, ApJ, 483, 675 [NASA ADS] [CrossRef] [Google Scholar]
- Dall’Ora, M., Botticella, M. T., Pumo, M. L., et al. 2014, ApJ, 787, 139 [CrossRef] [Google Scholar]
- de Vaucouleurs, G., de Vaucouleurs, A., Corwin, H. G. J., et al. 1991, Third Reference Catalogue of Bright Galaxies (Springer) [Google Scholar]
- Dessart, L., & Hillier, D. J. 2006, A&A, 447, 691 [NASA ADS] [CrossRef] [EDP Sciences] [Google Scholar]
- Dessart, L., Hillier, D. J., Audit, E., Livne, E., & Waldman, R. 2016, MNRAS, 458, 2094 [Google Scholar]
- Ensman, L., & Burrows, A. 1992, ApJ, 393, 742 [NASA ADS] [CrossRef] [Google Scholar]
- Fang, K., Metzger, B. D., Vurm, I., Aydi, E., & Chomiuk, L. 2020, ApJ, 904, 4 [NASA ADS] [CrossRef] [Google Scholar]
- Faran, T., Poznanski, D., Filippenko, A. V., et al. 2014a, MNRAS, 442, 844 [NASA ADS] [CrossRef] [Google Scholar]
- Faran, T., Poznanski, D., Filippenko, A. V., et al. 2014b, MNRAS, 445, 554 [NASA ADS] [CrossRef] [Google Scholar]
- Fassia, A., Meikle, W. P. S., Vacca, W. D., et al. 2000, MNRAS, 318, 1093 [Google Scholar]
- Fassia, A., Meikle, W. P. S., Chugai, N., et al. 2001, MNRAS, 325, 907 [NASA ADS] [CrossRef] [Google Scholar]
- Fransson, C., Chevalier, R. A., Filippenko, A. V., et al. 2002, ApJ, 572, 350 [NASA ADS] [CrossRef] [Google Scholar]
- Fransson, C., Ergon, M., Challis, P. J., et al. 2014, ApJ, 797, 118 [Google Scholar]
- Gal-Yam, A., Arcavi, I., Ofek, E. O., et al. 2014, Nature, 509, 471 [CrossRef] [Google Scholar]
- Gehrels, N., & Swift, 2004, Am. Astron. Soc. Meeting Abstr., 205, 116.01 [Google Scholar]
- Graham, M. J., Kulkarni, S. R., Bellm, E. C., et al. 2019, PASP, 131, 078001 [Google Scholar]
- Gutiérrez, C. P., Anderson, J. P., Hamuy, M., et al. 2014, ApJ, 786, L15 [CrossRef] [Google Scholar]
- Gutiérrez, C. P., Anderson, J. P., Hamuy, M., et al. 2017, ApJ, 850, 90 [CrossRef] [Google Scholar]
- Hatchett, S., Buff, J., & McCray, R. 1976, ApJ, 206, 847 [NASA ADS] [CrossRef] [Google Scholar]
- Heger, A., Fryer, C. L., Woosley, S. E., Langer, N., & Hartmann, D. H. 2003, ApJ, 591, 288 [CrossRef] [Google Scholar]
- Hillier, D. J., & Dessart, L. 2019, A&A, 631, A8 [NASA ADS] [CrossRef] [EDP Sciences] [Google Scholar]
- Hosseinzadeh, G., Valenti, S., McCully, C., et al. 2018, ApJ, 861, 63 [NASA ADS] [CrossRef] [Google Scholar]
- Huang, C., & Chevalier, R. A. 2018, MNRAS, 475, 1261 [NASA ADS] [CrossRef] [Google Scholar]
- Jacobson-Galán, W. V., Dessart, L., Jones, D. O., et al. 2022, ApJ, 924, 15 [CrossRef] [Google Scholar]
- Jacobson-Galán, W. V., Dessart, L., Margutti, R., et al. 2023, ApJ, 954, L42 [CrossRef] [Google Scholar]
- Jerkstrand, A. 2017, in Handbook of Supernovae, eds. A. W. Alsabti, & P. Murdin (Springer Reference), 795 [Google Scholar]
- Jerkstrand, A., Fransson, C., Maguire, K., et al. 2012, A&A, 546, A28 [NASA ADS] [CrossRef] [EDP Sciences] [Google Scholar]
- Jerkstrand, A., Smartt, S. J., Fraser, M., et al. 2014, MNRAS, 439, 3694 [Google Scholar]
- Jerkstrand, A., Smartt, S. J., Sollerman, J., et al. 2015, MNRAS, 448, 2482 [Google Scholar]
- Jones, D. O., Foley, R. J., Narayan, G., et al. 2021, ApJ, 908, 143 [NASA ADS] [CrossRef] [Google Scholar]
- Junde, H. 1999, Nucl. Data Sheets, 86, 315 [NASA ADS] [CrossRef] [Google Scholar]
- Kallman, T., & McCray, R. 1980, ApJ, 242, 615 [Google Scholar]
- Kamiński, T., Tylenda, R., Kiljan, A., et al. 2021, A&A, 655, A32 [NASA ADS] [CrossRef] [EDP Sciences] [Google Scholar]
- Kastner, S. O., & Bhatia, A. K. 1996, MNRAS, 279, 1137 [Google Scholar]
- Leonard, D. C., Filippenko, A. V., Barth, A. J., & Matheson, T. 2000, ApJ, 536, 239 [Google Scholar]
- Li, G., Hu, M., Li, W., et al. 2024, Nature, 627, 754 [NASA ADS] [CrossRef] [Google Scholar]
- Lipunov, V. M., Krylov, A. V., Kornilov, V. G., et al. 2004, Astron. Nachr., 325, 580 [Google Scholar]
- Liu, X.-W., & Danziger, J. 1993, MNRAS, 261, 465 [Google Scholar]
- Lodders, K. 2003, ApJ, 591, 1220 [Google Scholar]
- Lodders, K. 2019, arXiv e-prints [arXiv:1912.00844] [Google Scholar]
- MacAlpine, G. M., McGaugh, S. S., Mazzarella, J. M., & Uomoto, A. 1989, ApJ, 342, 364 [Google Scholar]
- MacAlpine, G. M., Ecklund, T. C., Lester, W. R., Vanderveer, S. J., & Strolger, L.-G. 2007, AJ, 133, 81 [Google Scholar]
- Maguire, K., Jerkstrand, A., Smartt, S. J., et al. 2012, MNRAS, 420, 3451 [Google Scholar]
- Makarov, D., Prugniel, P., Terekhova, N., Courtois, H., & Vauglin, I. 2014, A&A, 570, A13 [NASA ADS] [CrossRef] [EDP Sciences] [Google Scholar]
- Margon, B., & Cohen, J. G. 1978, ApJ, 222, L33 [Google Scholar]
- Masci, F. J., Laher, R. R., Rusholme, B., et al. 2019, PASP, 131, 018003 [Google Scholar]
- McClintock, J. E., Canizares, C. R., & Tarter, C. B. 1975, ApJ, 198, 641 [NASA ADS] [CrossRef] [Google Scholar]
- Mihalas, D., & Hummer, D. G. 1973, ApJ, 179, 827 [Google Scholar]
- Miller, A. A., Smith, N., Li, W., et al. 2010, AJ, 139, 2218 [NASA ADS] [CrossRef] [Google Scholar]
- Modjaz, M., Li, W., Butler, N., et al. 2009, ApJ, 702, 226 [NASA ADS] [CrossRef] [Google Scholar]
- Moore, C. E. 1945, Contrib. Princeton Univ. Obs., 20, 1 [NASA ADS] [Google Scholar]
- Moriya, T., Tominaga, N., Blinnikov, S. I., Baklanov, P. V., & Sorokina, E. I. 2011, MNRAS, 415, 199 [NASA ADS] [CrossRef] [Google Scholar]
- Moriya, T. J., Sanyal, D., & Langer, N. 2015, A&A, 575, L10 [NASA ADS] [CrossRef] [EDP Sciences] [Google Scholar]
- Morozova, V., Piro, A. L., Renzo, M., et al. 2015, ApJ, 814, 63 [Google Scholar]
- Mujortova, N. B., Wavasseur, M., Tranin, H., et al. 2024, Trans. Name Server Class. Rep., 2024-465, 1 [Google Scholar]
- Nadyozhin, D. K. 1994, ApJS, 92, 527 [Google Scholar]
- Nagy, A. P., & Vinkó, J. 2016, A&A, 589, A53 [NASA ADS] [CrossRef] [EDP Sciences] [Google Scholar]
- Nagy, A. P., Ordasi, A., Vinkó, J., & Wheeler, J. C. 2014, A&A, 571, A77 [NASA ADS] [CrossRef] [EDP Sciences] [Google Scholar]
- Nasa High Energy Astrophysics Science Archive Research Center (Heasarc), 2014, HEAsoft: Unified Release of FTOOLS and XANADU, Astrophysics Source Code Library [record ascl:1408.004] [Google Scholar]
- Niemela, V. S., Ruiz, M. T., & Phillips, M. M. 1985, ApJ, 289, 52 [NASA ADS] [CrossRef] [Google Scholar]
- Nomoto, K., Hashimoto, M., Tsujimoto, T., et al. 1997, Nucl. Phys. A, 616, 79 [NASA ADS] [CrossRef] [Google Scholar]
- Onori, F., Cannizzaro, G., Jonker, P. G., et al. 2019, MNRAS, 489, 1463 [CrossRef] [Google Scholar]
- Osterbrock, D. E., & Ferland, G. J. 2006, Astrophysics of Gaseous Nebulae and Active Galactic Nuclei (University Science Books) [Google Scholar]
- Pastorello, A., Wang, X. F., Ciabattari, F., et al. 2016, MNRAS, 456, 853 [Google Scholar]
- Phillips, M. M., Hamuy, M., Maza, J., et al. 1990, PASP, 102, 299 [Google Scholar]
- Pitik, T., Tamborra, I., Lincetto, M., & Franckowiak, A. 2023, MNRAS, 524, 3366 [NASA ADS] [CrossRef] [Google Scholar]
- Polshaw, J., Kotak, R., Dessart, L., et al. 2016, A&A, 588, A1 [NASA ADS] [CrossRef] [EDP Sciences] [Google Scholar]
- Quimby, R. M., Wheeler, J. C., Höflich, P., et al. 2007, ApJ, 666, 1093 [NASA ADS] [CrossRef] [Google Scholar]
- Rank, D. M., Pinto, P. A., Woosley, S. E., et al. 1988, Nature, 331, 505 [NASA ADS] [CrossRef] [Google Scholar]
- Rauscher, T., Heger, A., Hoffman, R. D., & Woosley, S. E. 2002, ApJ, 576, 323 [Google Scholar]
- Richmond, M. W., Treffers, R. R., Filippenko, A. V., et al. 1994, AJ, 107, 1022 [Google Scholar]
- Rodrigo, C., & Solano, E. 2020, XIV.0 Scientific Meeting (virtual) of the Spanish Astronomical Society, 182 [Google Scholar]
- Rodrigo, C., Solano, E., & Bayo, A. 2012, SVO Filter Profile Service Version 1.0, IVOA Working Draft 15 October 2012 [Google Scholar]
- Rodríguez, Ó., Meza, N., Pineda-García, J., & Ramirez, M. 2021, MNRAS, 505, 1742 [CrossRef] [Google Scholar]
- Rybicki, G. B., & Lightman, A. P. 1986, Radiative Processes in Astrophysics (Wiley) [Google Scholar]
- Salmaso, I., Cappellaro, E., Tartaglia, L., et al. 2023, A&A, 673, A127 [NASA ADS] [CrossRef] [EDP Sciences] [Google Scholar]
- Sanders, N. E., Soderberg, A. M., Gezari, S., et al. 2015, ApJ, 799, 208 [NASA ADS] [CrossRef] [Google Scholar]
- Schlafly, E. F., & Finkbeiner, D. P. 2011, ApJ, 737, 103 [Google Scholar]
- Schlegel, E. M. 1990, MNRAS, 244, 269 [NASA ADS] [Google Scholar]
- Science Software Branch at STScI, 2012, PyRAF: Python alternative for IRAF, Astrophysics Source Code Library [record ascl:1207.011] [Google Scholar]
- Selvelli, P., Danziger, J., & Bonifacio, P. 2007, A&A, 464, 715 [NASA ADS] [CrossRef] [EDP Sciences] [Google Scholar]
- Shivvers, I., Groh, J. H., Mauerhan, J. C., et al. 2015, ApJ, 806, 213 [NASA ADS] [CrossRef] [Google Scholar]
- Smartt, S. J. 2009, ARA&A, 47, 63 [NASA ADS] [CrossRef] [Google Scholar]
- Smith, N. 2017, in Handbook of Supernovae, eds. A. W. Alsabti, & P. Murdin (Springer Reference), 403 [Google Scholar]
- Smith, N., Humphreys, R. M., Davidson, K., et al. 2001, AJ, 121, 1111 [CrossRef] [Google Scholar]
- Smith, N., Mauerhan, J. C., Cenko, S. B., et al. 2015, MNRAS, 449, 1876 [Google Scholar]
- Smith, K. W., Smartt, S. J., Young, D. R., et al. 2020, PASP, 132, 085002 [Google Scholar]
- Smith, N., Pearson, J., Sand, D. J., et al. 2023, ApJ, 956, 46 [NASA ADS] [CrossRef] [Google Scholar]
- Sobolev, V. V. 1957, Soviet Astron., 1, 678 [Google Scholar]
- Soderberg, A. M., Berger, E., Page, K. L., et al. 2008, Nature, 453, 469 [NASA ADS] [CrossRef] [Google Scholar]
- Steeghs, D., Galloway, D. K., Ackley, K., et al. 2022, MNRAS, 511, 2405 [NASA ADS] [CrossRef] [Google Scholar]
- Suzuki, A., & Shigeyama, T. 2010, ApJ, 717, L154 [NASA ADS] [CrossRef] [Google Scholar]
- Taddia, F., Stritzinger, M. D., Sollerman, J., et al. 2013, A&A, 555, A10 [NASA ADS] [CrossRef] [EDP Sciences] [Google Scholar]
- Taddia, F., Stritzinger, M. D., Fransson, C., et al. 2020, A&A, 638, A92 [NASA ADS] [CrossRef] [EDP Sciences] [Google Scholar]
- Tartaglia, L. 2016, Ph.D. Thesis, Astronomical Observatory of Padua; University of Padua, Department of Physics and Astronomy [Google Scholar]
- Tartaglia, L., Sand, D. J., Valenti, S., et al. 2018, ApJ, 853, 62 [Google Scholar]
- Tartaglia, L., Pastorello, A., Sollerman, J., et al. 2020, A&A, 635, A39 [NASA ADS] [CrossRef] [EDP Sciences] [Google Scholar]
- Tartaglia, L., Sand, D. J., Groh, J. H., et al. 2021, ApJ, 907, 52 [NASA ADS] [CrossRef] [Google Scholar]
- Terreran, G., Jerkstrand, A., Benetti, S., et al. 2016, MNRAS, 462, 137 [Google Scholar]
- Terreran, G., Jacobson-Galán, W. V., Groh, J. H., et al. 2022, ApJ, 926, 20 [NASA ADS] [CrossRef] [Google Scholar]
- Tody, D. 1986, in Instrumentation in astronomy VI, ed. D. L. Crawford, SPIE Conf. Ser., 627, 733 [Google Scholar]
- Tody, D. 1993, in Astronomical Data Analysis Software and Systems II, eds. R. J. Hanisch, R. J. V. Brissenden, & J. Barnes, ASP Conf. Ser., 52, 173 [Google Scholar]
- Tominaga, N., Morokuma, T., Blinnikov, S. I., et al. 2011, ApJS, 193, 20 [NASA ADS] [CrossRef] [Google Scholar]
- Tully, R. B., Courtois, H. M., & Sorce, J. G. 2016, AJ, 152, 50 [Google Scholar]
- Turatto, M., Cappellaro, E., Danziger, I. J., et al. 1993, MNRAS, 262, 128 [CrossRef] [Google Scholar]
- Valenti, S., Howell, D. A., Stritzinger, M. D., et al. 2016, MNRAS, 459, 3939 [NASA ADS] [CrossRef] [Google Scholar]
- Valerin, G., Pastorello, A., Reguitti, A., et al. 2025, A&A, 695, A42 [NASA ADS] [CrossRef] [EDP Sciences] [Google Scholar]
- Wagenblast, R., Bertout, C., & Bastian, U. 1983, A&A, 120, 6 [NASA ADS] [Google Scholar]
- Weymann, R. J., & Williams, R. E. 1969, ApJ, 157, 1201 [Google Scholar]
- Wiggins, P. 2024, Trans. Name Server Discovery Rep., 2024–281, 1 [Google Scholar]
- Wooden, D. H., Rank, D. M., Bregman, J. D., et al. 1993, ApJS, 88, 477 [NASA ADS] [CrossRef] [Google Scholar]
- Yaron, O., Perley, D. A., Gal-Yam, A., et al. 2017, Nat. Phys., 13, 510 [NASA ADS] [CrossRef] [Google Scholar]
- Zimmerman, E. A., Irani, I., Chen, P., et al. 2024, Nature, 627, 759 [Google Scholar]
All Tables
All Figures
|
Fig. 1. Colour image of SN 2024bch and its host galaxy NGC 3206, obtained combining u-, g-, r-, and i-band data obtained on 2024 February 5 with the 1.82 m Copernico telescope with AFOSC. The transient is the bright source in the middle of the inset. |
| In the text | |
|
Fig. 2. UltraViolet Optical Telescope (UVOT) (w2, m2 w1 u b v; left) and (right) optical ugBVriz light curves of SN 2024bch. Magnitudes were not corrected for extinction. UV and BV magnitudes were calibrated in the Vega and griz magnitudes in the AB photometric systems. |
| In the text | |
|
Fig. 3. Colour evolution of SN 2024bch compared to those of selected transients that show high-ionisation features in their early spectra. Objects were selected from those with a similar evolution in their main features (including the duration of the narrow features and SN type) with data available in the literature. In the upper panel, the evolution of the U − g colours for SNe 2017ahn, 2020pni, and 2022jox was included, since u-band photometry for these objects was not available. U-band magnitudes for these objects were converted in the AB photometric system adopting the Vega – AB magnitude conversions reported in Blanton & Roweis (2007). In the same panel, the inset includes a zoom-in of the u/U − g early evolution, which shows a rapid decrease in the colours within approximately the first 3 days after explosion for all the selected objects (see the main text). Phases refer to the estimated explosion epochs reported in the literature. Light curves of SN 2023ixf were collected from Li et al. (2024) and Zimmerman et al. (2024). |
| In the text | |
|
Fig. 4. Evolution of the radius and temperature inferred from the blacbody fit to the early SED of SN 2024bch compared to those of SN 2012aw (Dall’Ora et al. 2014) computed using the same approach. |
| In the text | |
|
Fig. 5. Evolution of the bolometric luminosity of SN 2024bch along with the model used to reproduce the observed data. Dashed lines represent the luminosity contribution from both the envelope and the bulk of the ejecta. The solid green line is the sum of the two components, while the solid light blue line shows the contribution of the extra diffusion time introduced by the CSM. |
| In the text | |
|
Fig. 6. Evolution of the late bolometric luminosity of SN 2024bch with respect to the r-band light curve (see the main text), including the fit on the radioactive tail. The fit assuming full γ-ray trapping is also reported. |
| In the text | |
|
Fig. 7. Early spectroscopic evolution of SN 2024bch (up to +16 days ). Spectra were not corrected for Galactic extinction along the line of sight. The circle with cross, ⊕, symbols mark the position of the main telluric features. Zoom-in panels show the Hβ and He I/NaID regions (at +7 and +8 days for Hβ, and +7, +8, and +16 days for NaID) and Hα, with expansion velocities referred to the rest-frame wavelengths marked with vertical yellow lines. Rest-frame phases refer to the estimated explosion epoch. |
| In the text | |
|
Fig. 8. Comparison of the higher-resolution spectrum available (R ∼ 3500) for SN 2024bch obtained ≃ {+}3.5 days with AFOSC with the one of SN 1998S (published by Shivvers et al. 2015) at a similar phase (adopting JD = 2450872.5 as reported by Fassia et al. 2000). |
| In the text | |
|
Fig. 9. Comparison between the spectroscopic evolution of SN 2024bch and SN 1998S up to ∼ +140 days (spectra from Leonard et al. 2000; Fassia et al. 2001). |
| In the text | |
|
Fig. 10. Comparison between the bolometric light curve of SN 2024bch and ‘Model A’ from Dessart et al. (2016), which was built to explain the luminosity evolution of SN 1998S. The model fails to reproduce both the fast rise and the overall luminosity of SN 2024bch, which suggests that ejecta-CSM interaction does not play a role in powering its light curve. |
| In the text | |
|
Fig. 11. From left to right: Optical spectroscopic evolution of SN 2024bch at t≥ +42 days (Panel 1; along with the identification of the most prominent spectral features), evolution of the Hα profile (panel 2), Hβ (panel 3), and NaIDPanel 4 features in the velocity plane at the same epochs. Yellow lines correspond to the rest-frame wavelengths, while blue lines mark the evolution of the P Cygni absorption minima. Phases refer to the estimated explosion epoch. |
| In the text | |
|
Fig. 12. Multi-Gaussian fit to the spectral region around [CaII]λλ7291, 7324, following the prescriptions of Jerkstrand et al. (2015) and Terreran et al. (2016). The fit was performed on the spectrum obtained at +154 days. |
| In the text | |
|
Fig. 13. Colour map showing the dependence of the O mass on the escape probabilities β6300, 6363 and β5577, according to Eqs. (6) and (7). Dashed black lines trace the location of some relevant O mass values. The solid green line displays the constant β5577/β6300, 6363 ratio found through Eq. (6). The position of SN 2024bch in this plane, based on the measurements performed on the spectrum at +154 days, is marked with a green star. |
| In the text | |
|
Fig. 14. Schematic view, not to scale, of the preferred geometrical configuration for the CSM of SN 2024bch. An outer shell with Rin ≳ 4.4 1015 cm} is reached by radiation at different times and emits high-ionisation features through the Bowen fluorescence mechanism. This scenario can simultaneously explain the evolution of the luminosities and redshifts of narrow features without the need for ejecta-CSM interaction as an additional source of energy. |
| In the text | |
Current usage metrics show cumulative count of Article Views (full-text article views including HTML views, PDF and ePub downloads, according to the available data) and Abstracts Views on Vision4Press platform.
Data correspond to usage on the plateform after 2015. The current usage metrics is available 48-96 hours after online publication and is updated daily on week days.
Initial download of the metrics may take a while.