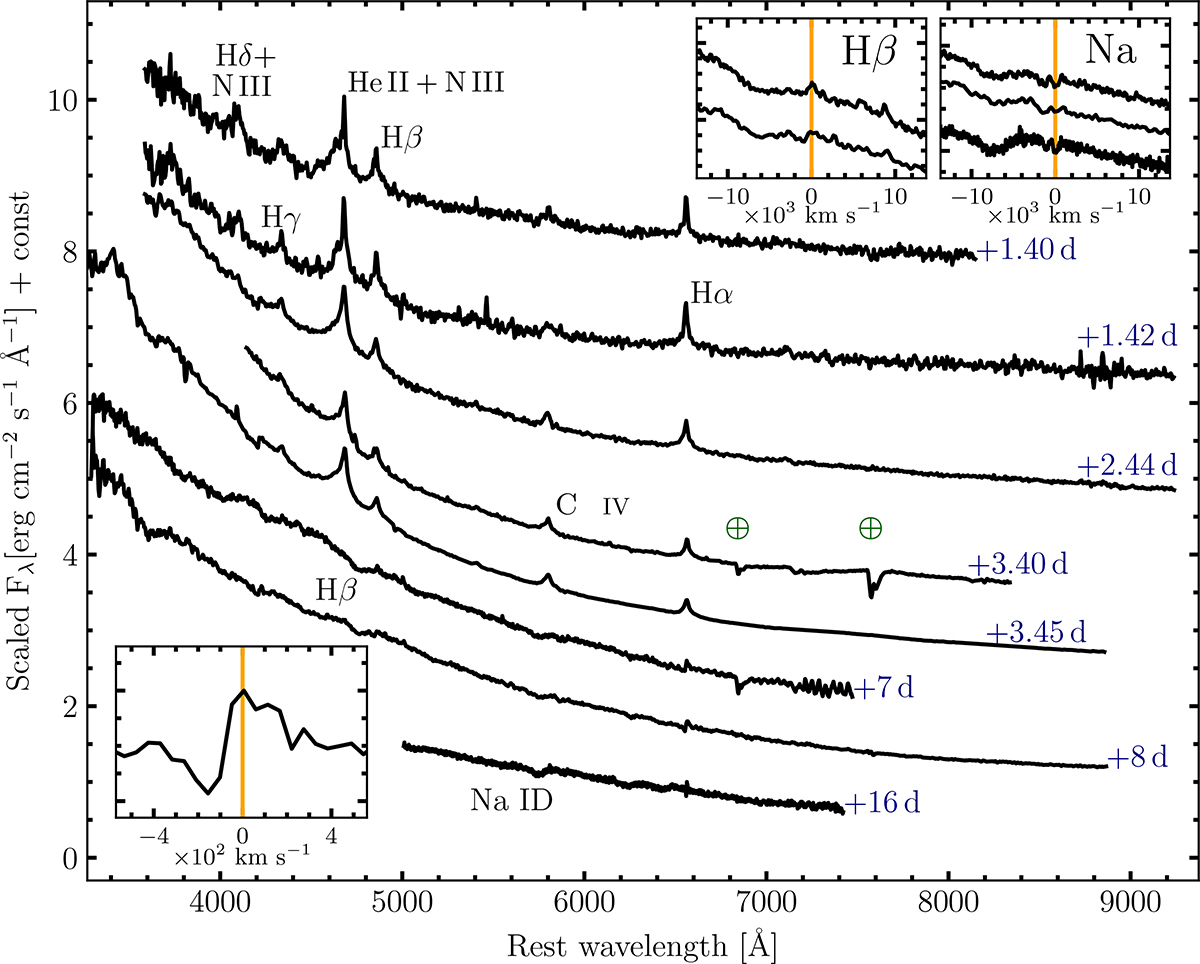
Fig. 7.
Download original image
Early spectroscopic evolution of SN 2024bch (up to +16 days ). Spectra were not corrected for Galactic extinction along the line of sight. The circle with cross, ⊕, symbols mark the position of the main telluric features. Zoom-in panels show the Hβ and He I/NaID regions (at +7 and +8 days for Hβ, and +7, +8, and +16 days for NaID) and Hα, with expansion velocities referred to the rest-frame wavelengths marked with vertical yellow lines. Rest-frame phases refer to the estimated explosion epoch.
Current usage metrics show cumulative count of Article Views (full-text article views including HTML views, PDF and ePub downloads, according to the available data) and Abstracts Views on Vision4Press platform.
Data correspond to usage on the plateform after 2015. The current usage metrics is available 48-96 hours after online publication and is updated daily on week days.
Initial download of the metrics may take a while.