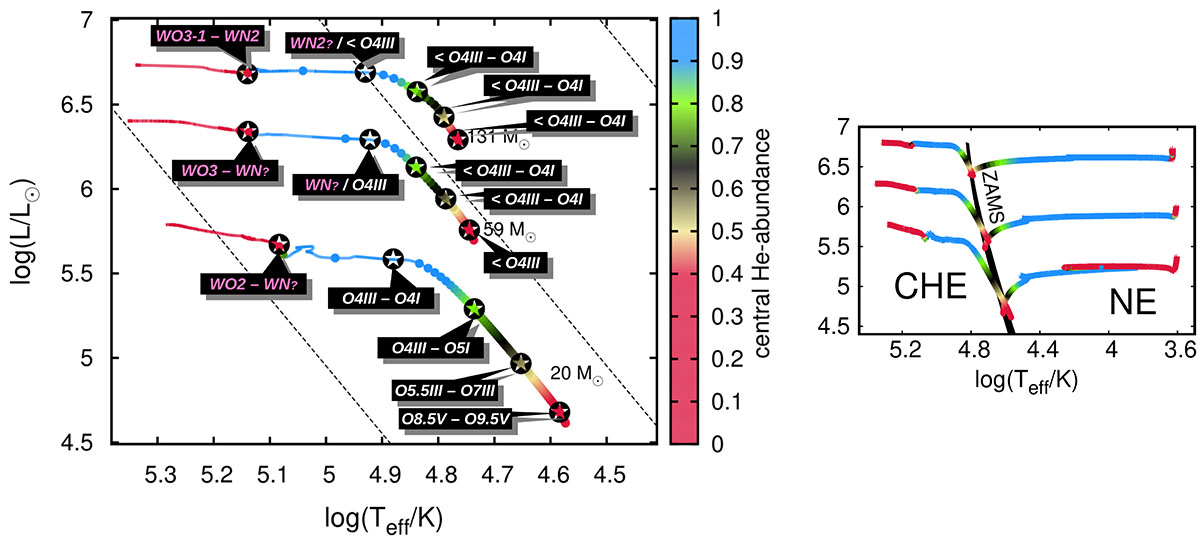
Fig. 1.
Download original image
Left: Hertzsprung–Russell diagram summarizing the findings of Paper II (their Fig. 1 & Table 4) and our Sect. 2.2, showing that chemically homogeneous stellar evolution at I Zw 18 composition proceeds from class O via a shorter-lived class WN to a longer-lived WO phase – i.e. without experiencing any long-term WC phase. Evolutionary models are taken from Paper I (main-sequence) and Szécsi et al. (2022, post-main-sequence), without correcting for the wind optical depth (see the last paragraph of Sect. 2.2). Initial masses are labelled, showing where the tracks start their evolution, which proceeds towards the hot side of the diagram (i.e. CHE). Colours show the central helium mass fraction, and dots represent every 105 years of evolution. Dashes mark equiradial lines with 1, 10, and 100 R⊙ from left to right. The black star symbols represent the models for which PoWR synthetic spectra were computed in Paper II and Sect. 2.2. From right to left (note that the evolution progresses from red to blue, contrarily to classical massive-star evolution): main-sequence models with surface helium mass fractions of 0.28, 0.5, 0.75, and 0.98, while the fifth symbol on the very left corresponds to the core-helium-burning phase (post-main-sequence, Sect. 2.2). Spectral classification was performed in Paper II; the results (for four different assumptions about mass loss and clumping) were presented in their Table 4 and Appendix A. Here the labels summarize the ranges in class found there, except for the WN and WO stars which are discussed in Sect. 2.2 (see also Fig. 3). Right: HR diagram summarizing our findings from Paper I. Stellar models computed with I Zw 18’s chemical composition are shown following normal evolution (NE) towards the red supergiant branch with slow rotation (≲300 km s−1). With fast rotation, they are seen following CHE towards hot surface temperatures; that is, leftward from the ZAMS. This latter evolutionary path is what is elaborated upon in the left panel. For more details on how we construct a synthetic population out of both these kinds of models, see Sect 2.3.
Current usage metrics show cumulative count of Article Views (full-text article views including HTML views, PDF and ePub downloads, according to the available data) and Abstracts Views on Vision4Press platform.
Data correspond to usage on the plateform after 2015. The current usage metrics is available 48-96 hours after online publication and is updated daily on week days.
Initial download of the metrics may take a while.