Fig. 11.
Download original image
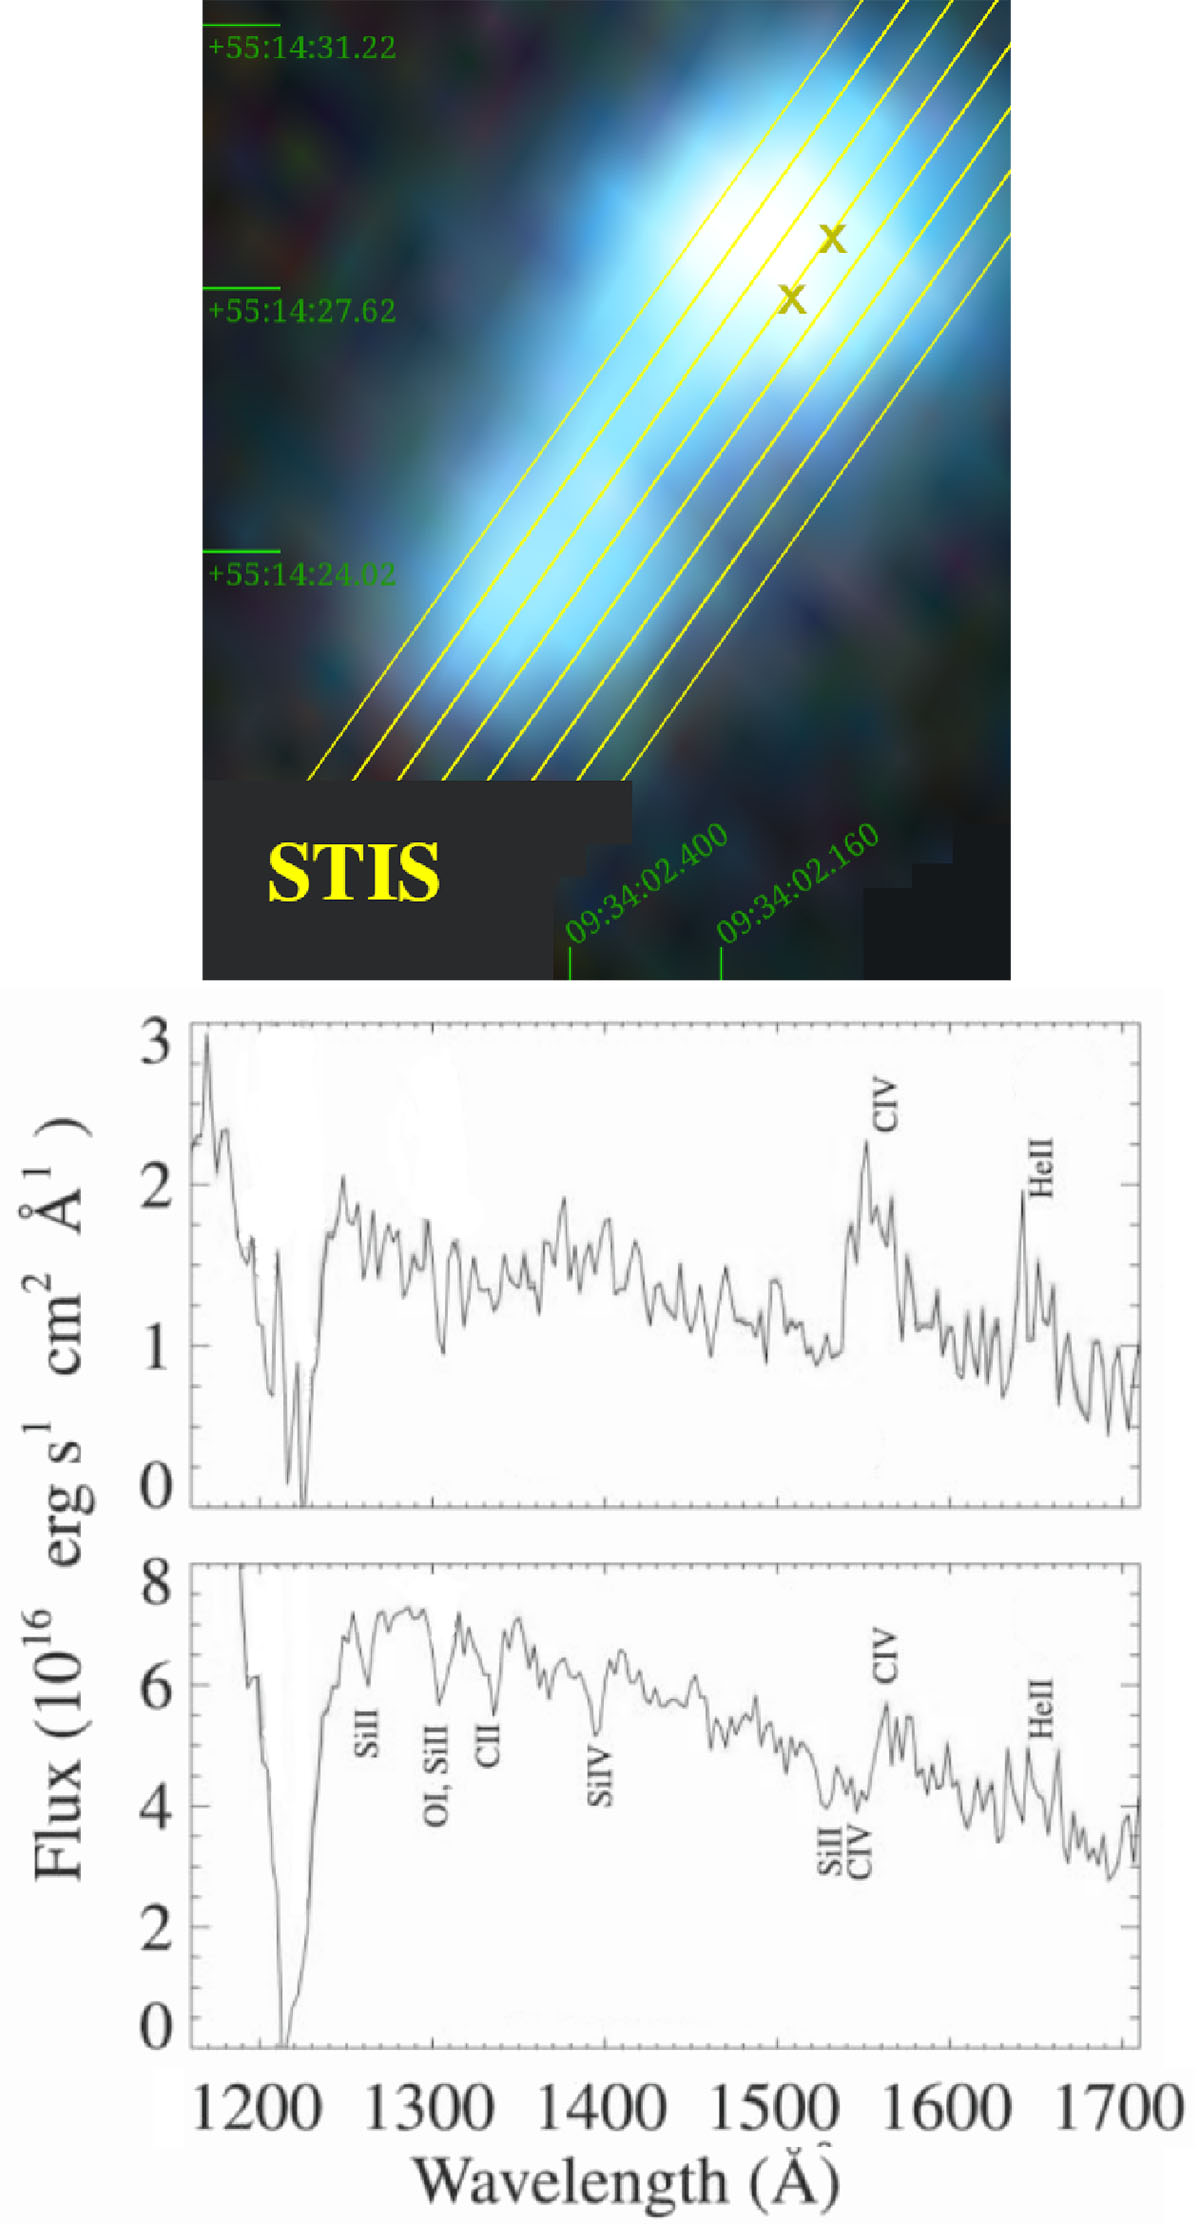
UV spectra reproduced from Brown et al. (2002, their Fig. 1). Observations taken with Hubble’s Space Telescope Imaging Spectrograph (STIS) using the G140L grating and the 52″ × 0![]() 5 slit. The two spectra (bottom) were taken from two clusters in the north-western region that contain C IV bumps (top, where Xs mark the approximate positions from which those spectra were extracted; see our Fig. 14 where these positions are more reliably pinpointed by the authors themselves). Note the presence of He II bumps, which are similar in size to the C IV bumps, consistently with out models (see Sect. 4.2).
5 slit. The two spectra (bottom) were taken from two clusters in the north-western region that contain C IV bumps (top, where Xs mark the approximate positions from which those spectra were extracted; see our Fig. 14 where these positions are more reliably pinpointed by the authors themselves). Note the presence of He II bumps, which are similar in size to the C IV bumps, consistently with out models (see Sect. 4.2).
Current usage metrics show cumulative count of Article Views (full-text article views including HTML views, PDF and ePub downloads, according to the available data) and Abstracts Views on Vision4Press platform.
Data correspond to usage on the plateform after 2015. The current usage metrics is available 48-96 hours after online publication and is updated daily on week days.
Initial download of the metrics may take a while.