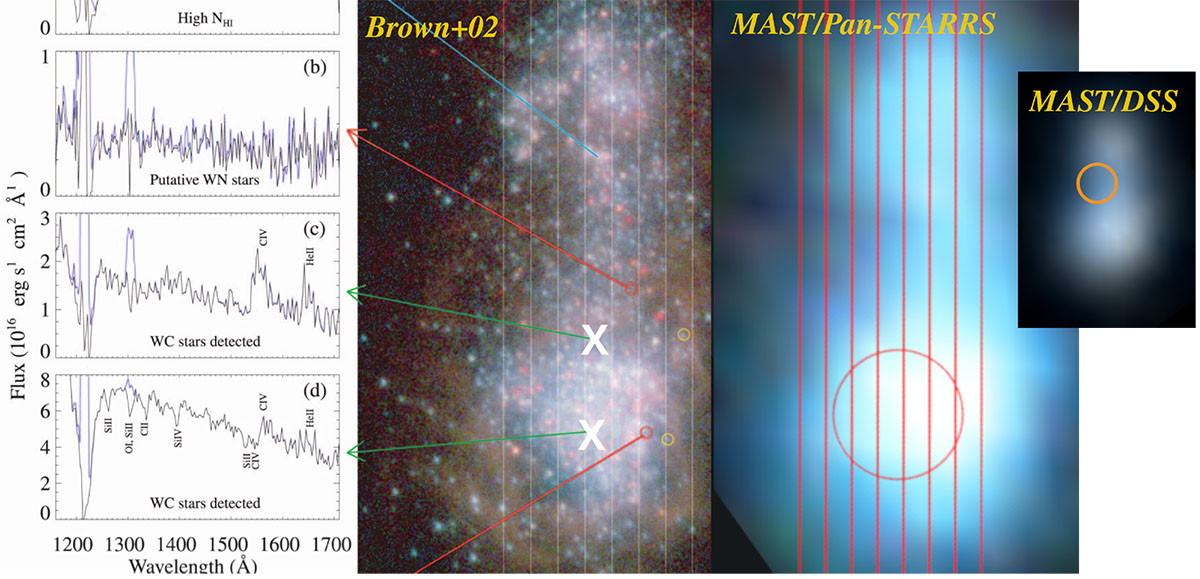
Fig. 14.
Download original image
HST measurements of I Zw 18. The panel labelled MAST/Pan-STARRS shows the circular aperture used for obtaining the highest signal-to-noise-ratio UV spectrum of I Zw 18 available to date, taken by COS (Berg et al. 2022). Circle and background image are the same as in Fig. 13 (taken from the MAST archive applying background image from the Pan-STARRS survey). The panels to the left correspond to STIS copied from Brown et al. (2002, mentioned also in Sect. 4.2 and Fig. 11, see details there). The positions where Brown et al. (2002) identified WR-like emission bumps (c and d) are marked by Xs for convenience. The panel labelled MAST/DSS demonstrates a discrepancy we found in the MAST Archive’s AstroView tool (see Sect. 4.3 for details). Our explanation for why the COS spectrum analysed by Berg et al. (2022, see their Fig. 12) does not display C IV emission – despite at least one of the Brown-sources seemingly being within the aperture – is that the field of view includes too much contaminating light: as demonstrated by Kehrig et al. (2016) using integral field spectroscopy of I Zw 18 (see our Fig. 10), stellar emission bumps clear out completely unless the spectra is taken from the right physical position of the galaxy.
Current usage metrics show cumulative count of Article Views (full-text article views including HTML views, PDF and ePub downloads, according to the available data) and Abstracts Views on Vision4Press platform.
Data correspond to usage on the plateform after 2015. The current usage metrics is available 48-96 hours after online publication and is updated daily on week days.
Initial download of the metrics may take a while.