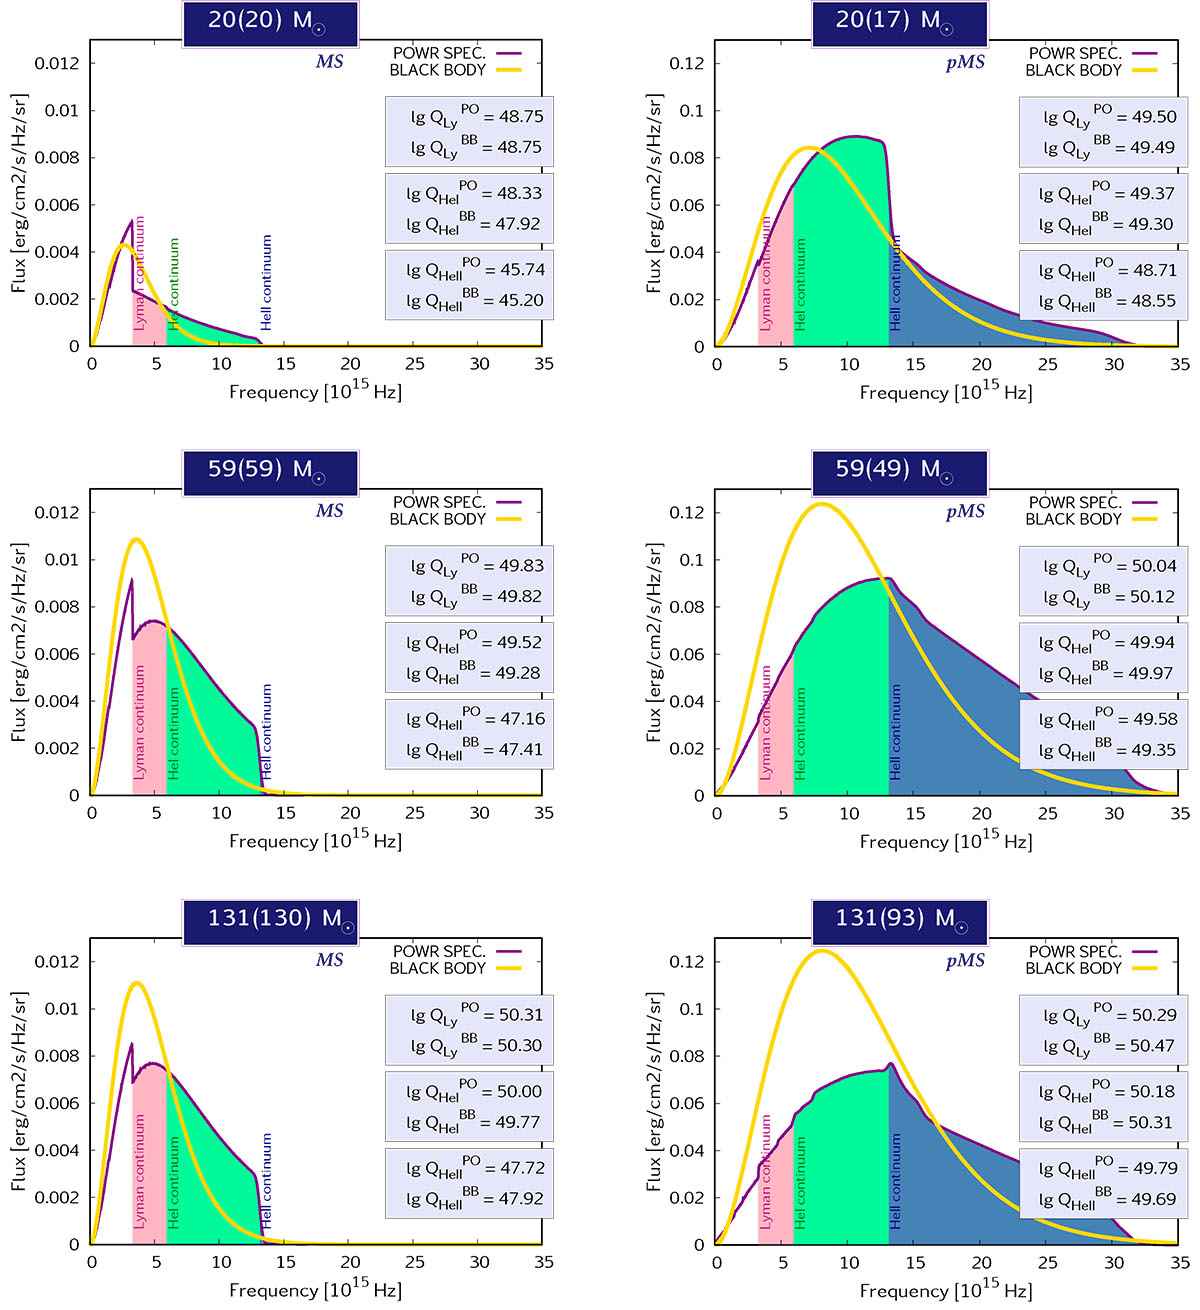
Fig. 2.
Download original image
Spectral energy distributions of our PoWR synthetic spectra of chemically homogeneously evolving massive stars published in Paper II with the corresponding black body distributions overplotted for context. The models correspond to the second (MS) and last (pMS) phases on the HR diagram in Fig. 1; their main physical parameters and ionizing fluxes are listed in Table B.1. Titles indicate the initial mass of the evolutionary models with the actual mass (i.e. the mass when the synthetic spectra were computed) in parenthesis. The three main ionizing continua (Lyman: < 912 Å, He I: < 504 Å, He II: < 228 Å ) are marked (note the X scale showing the frequency instead of the wavelength, in order to spread out the relevant high-energy parts of the distributions). Framed boxes present the number of ionizing photons predicted by both the PoWR models (unclumped, with nominal mass-loss rates) and the black body distributions, in units of log(s−1); the values being close to each other is an interesting coincidence. Left column: Models in the main-sequence (MS) phase with surface helium mass fraction of YS = 0.5. Right column: Models in the post-main-sequence (pMS) phase (in the case of the 131 M⊙ model, the late-pMS phase, see Sect. 2.2 and Fig. 4). Note the order of magnitude difference in the Y scale between the left column and the right column.
Current usage metrics show cumulative count of Article Views (full-text article views including HTML views, PDF and ePub downloads, according to the available data) and Abstracts Views on Vision4Press platform.
Data correspond to usage on the plateform after 2015. The current usage metrics is available 48-96 hours after online publication and is updated daily on week days.
Initial download of the metrics may take a while.