Fig. 4.
Download original image
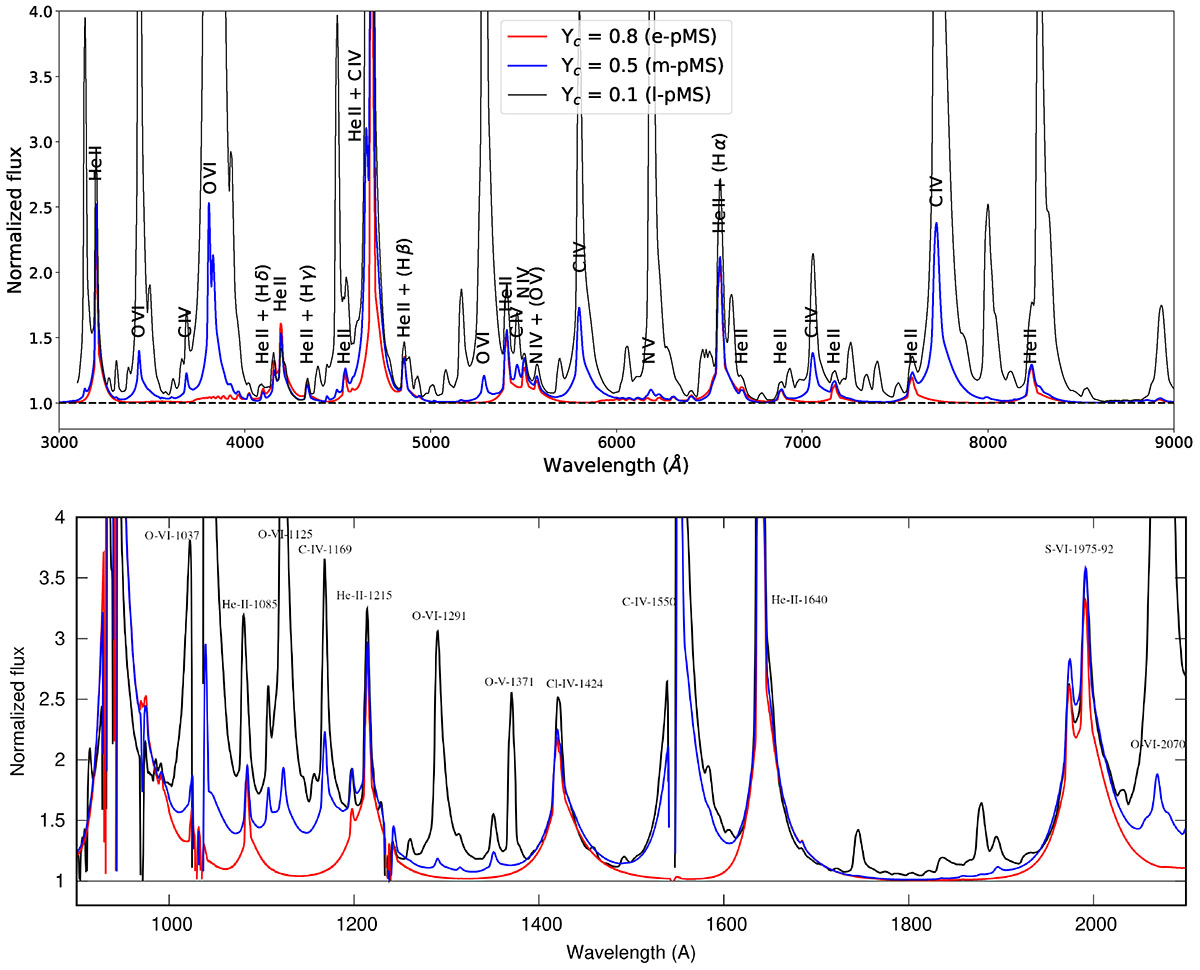
PoWR model spectra of individual stars during the post-main-sequence (core-helium burning) phase of the same evolutionary model (Mini = 131 M⊙, actual mass between 93−106 M⊙). The model’s approximate position is shown on the HR diagram in Fig. 1 by the last point (pMS phase) at around log(Teff/K) ∼ 5.14 and log(L/L⊙) ∼ 6.7. Top: Optical range. Bottom: UV range. Nominal mass loss rate and no clumping was assumed, to be consistent with previous work (see Paper II, and the discussion of the caveats in Sect. 5.2). YC indicates core-helium abundance and thus the evolutionary progress during the post-MS. The earliest model (red straight line, YC = 0.8, i.e. just burned about 20% of its helium in the core) shows prominent emission only in helium, while the mid (blue straight line, YC = 0.5) and late (black straight line, YC = 0.1, corresponding to the bottom right panel of Fig. 2) ones develop carbon and oxygen lines too. (The Cl and S lines are modelling side-effects, we do not expect them to show up in observations.) However, the distinguishing emission line C IIIλ5696 Å which serves as the basis of classifying a stars as WC (Crowther et al. 1998) is missing in all three models. So are the nitrogen emission lines that would categorize a star as late-type WN (Crowther et al. 1995; Smith et al. 1996; Crowther & Walborn 2011). If observed, therefore, these stars would be identified as early-type WN (i.e. WN2) and then during most of the core-helium burning, as WO – more precisely, WO 2 evolving to WO 1.
Current usage metrics show cumulative count of Article Views (full-text article views including HTML views, PDF and ePub downloads, according to the available data) and Abstracts Views on Vision4Press platform.
Data correspond to usage on the plateform after 2015. The current usage metrics is available 48-96 hours after online publication and is updated daily on week days.
Initial download of the metrics may take a while.