Fig. 5.
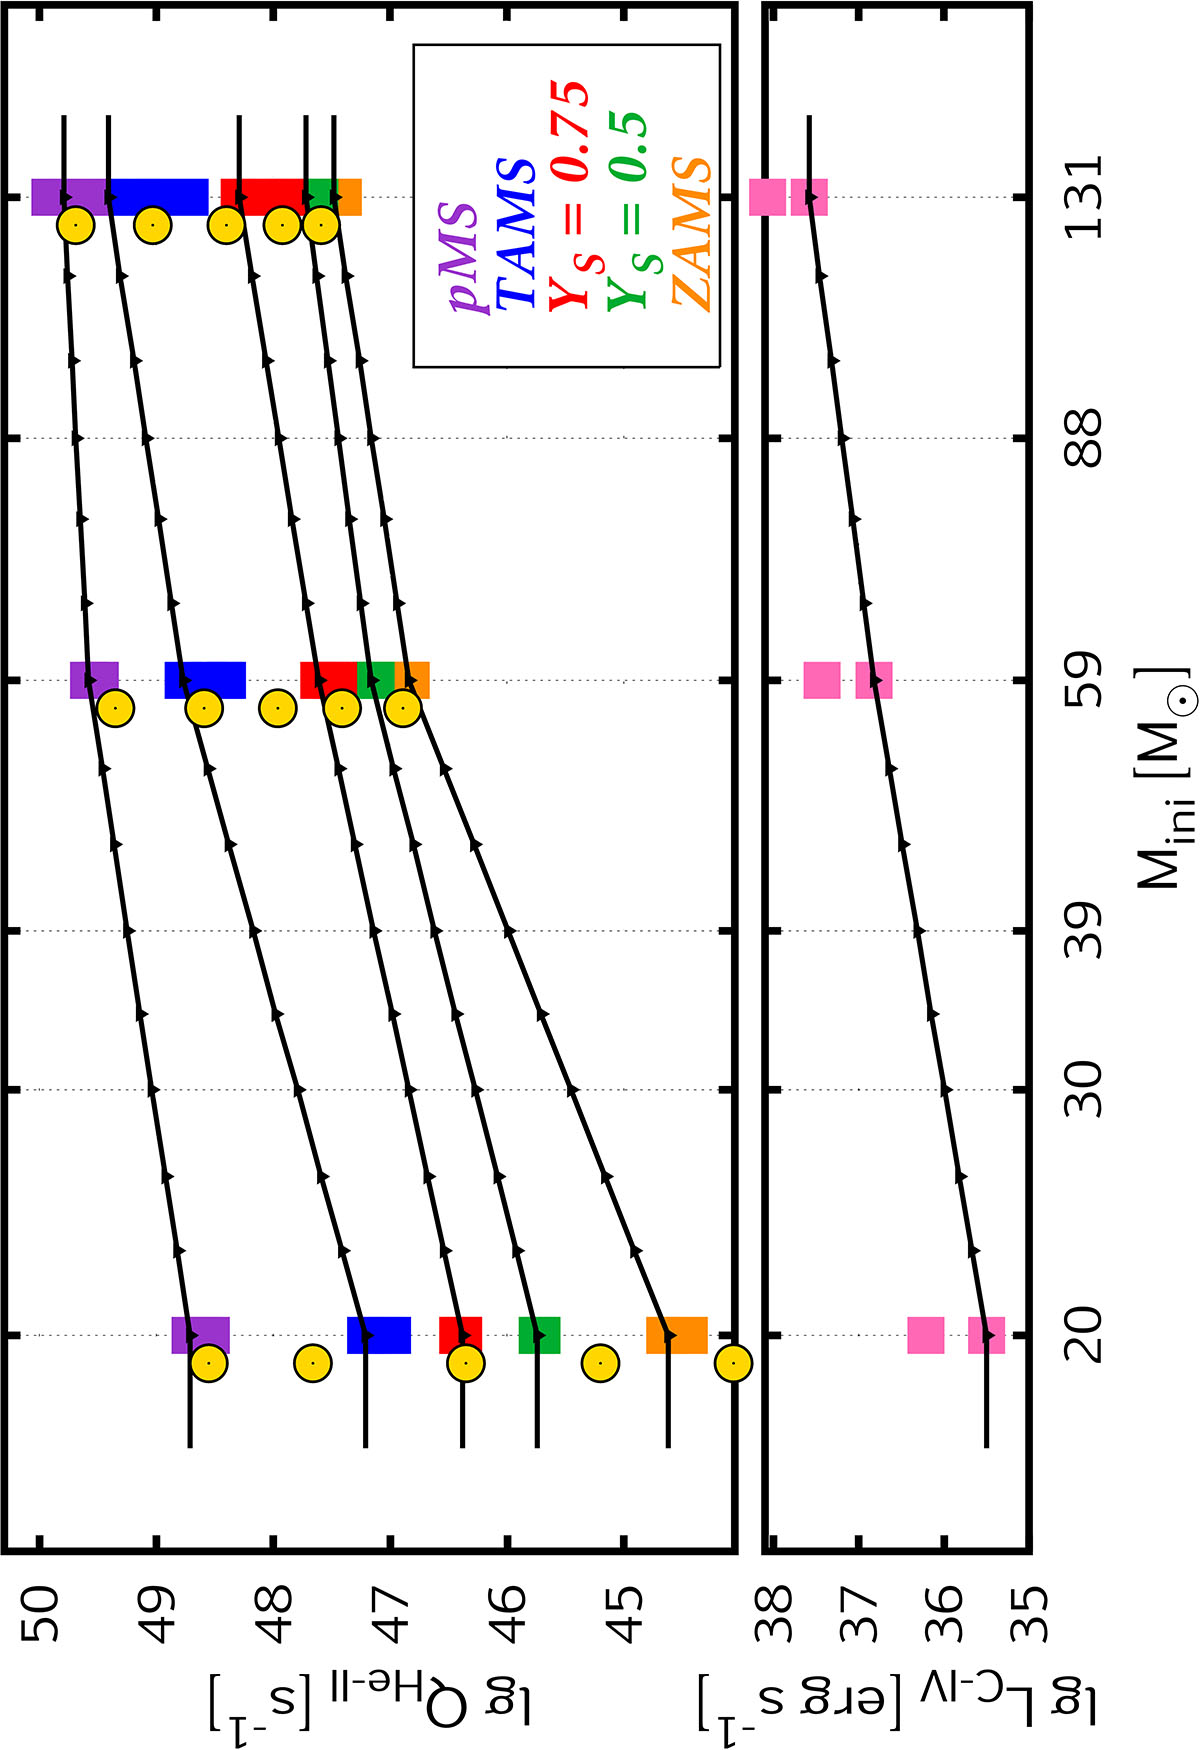
Download original image
Top panel: Number of ionizing photons in the He II continuum in all our spectral models from Paper II. Evolutionary stages are indicated by colours (ZAMS by yellow; two main sequence models with surface helium mass fractions YS = 0.5 and 0.75 by green and red, respectively; terminal-age-main-sequence model, TAMS, by blue; and post-main-sequence model, pMS, by purple). For every evolutionary stage, QHe II from all four spectral models of Paper II are shown (hence the spread in the coloured stripes). Yellow circles represent the He II ionizing photon number computed from corresponding black body distributions (see Fig. 2). To account for a population of massive stars, we interpolate linearly between the logarithm of the three simulated masses. Models with nominal mass-loss rate and unclumped wind are used; interpolated values are shown with the solid black lines, small triangles marking the bin sizes. Above and below our highest and lowest mass models, the values of those models are applied (down to 9 M⊙). Bottom panel: Same as the top panel, but for the line luminosities in C IVλ1550 Å of the pMS model. The second trio of pink rectangles with higher values correspond to clumped wind models (see also Fig. 6). Other line luminosities are treated the same way (see Sect. 2.4).
Current usage metrics show cumulative count of Article Views (full-text article views including HTML views, PDF and ePub downloads, according to the available data) and Abstracts Views on Vision4Press platform.
Data correspond to usage on the plateform after 2015. The current usage metrics is available 48-96 hours after online publication and is updated daily on week days.
Initial download of the metrics may take a while.