Fig. 6.
Download original image
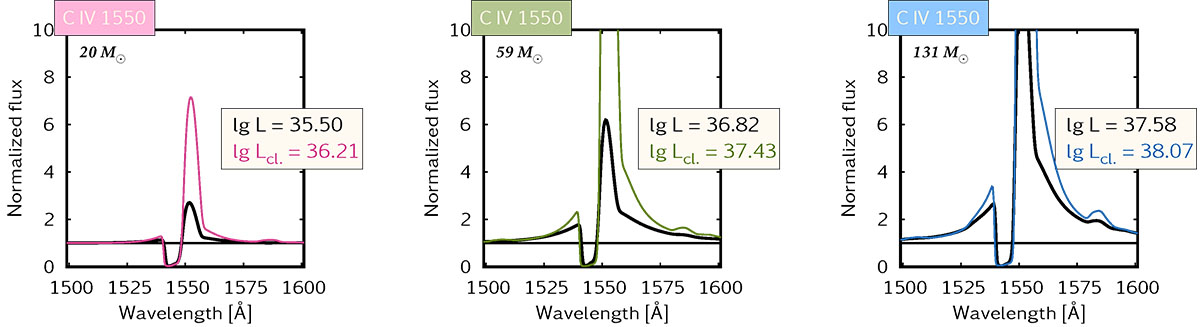
Normalized flux around the UV line C IVλ1550 Å in three post-main-sequence (l-pMS) spectral models with initial masses as indicated in the top left corner of the panels. Line luminosity (computed following Sect. 2.4) is given in the framed boxes in units of log(erg s−1); lg L stands for unclumped (clumping factor D = 1) while lg Lcl for clumped (D = 10) wind, see details in Paper II. When creating the synthetic population here (Sect. 2.3 and Sect. 3.1), we always apply the unclumped models’ predictions (i.e. black line). Other emission lines are presented in Figs. A.1–A.2. Based on this, we predict a ∼40–50 Å-wide emission bump from our population between 1550–1600 Å, which is indeed present in the observations in Fig. 11.
Current usage metrics show cumulative count of Article Views (full-text article views including HTML views, PDF and ePub downloads, according to the available data) and Abstracts Views on Vision4Press platform.
Data correspond to usage on the plateform after 2015. The current usage metrics is available 48-96 hours after online publication and is updated daily on week days.
Initial download of the metrics may take a while.