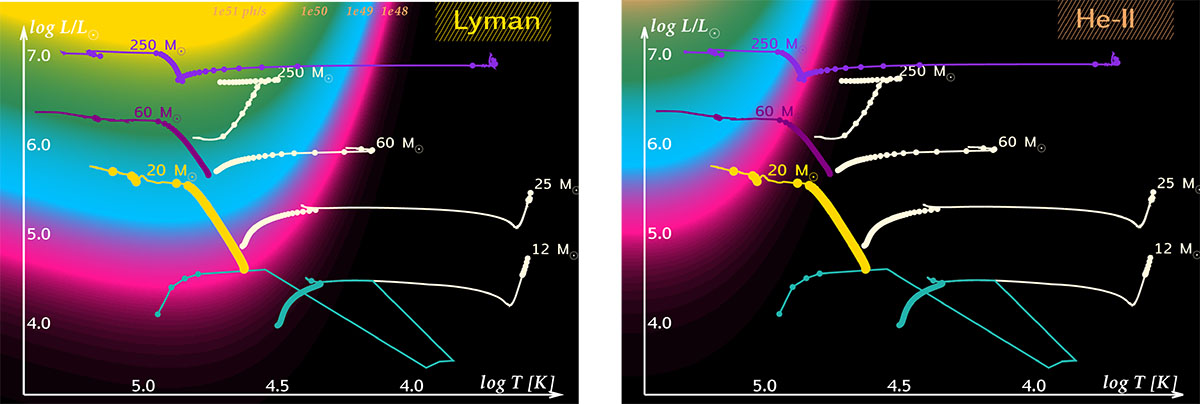
Fig. 7.
Download original image
Hertzsprung–Russell diagrams with background colours representing the number of Lyman (left) and He-II (right) continuum photons emitted by a black body with a given temperature and luminosity. Units are associated with colours (pink: 1048 ph s−1, blue: 1049 ph s−1, green: 1050 ph s−1, #FAF2BF;: 1051 ph s−1; a black background means < 1048 ph s−1). Stellar evolutionary model sequences are labelled with their initial masses. They are taken from the BoOST project (Szécsi et al. 2022), except for the turquoise line, which is a stripped binary model from Götberg et al. (2017). White lines mean Milky Way composition, where all models evolve the ‘normal’ way (although the most massive ones turn to the left eventually: this is classical Wolf–Rayet evolution). Purple and golden lines mean I Zw 18 composition, with one of the very massive models evolving normally (initial rotational velocity of 100 km s−1) and the others chemically homogeneously due to fast rotation (500 km s−1). Every 105 yr of evolution is marked with dot on the tracks. Including the 20 M⊙ model into our population synthesis runs (with a sufficiently long star formation episode, see Table 1) hardens the combined spectra considerably (reaching close to the observed I(4686)/I(β) ∼ 0.02), as the late phases of this model enter the pink zone in terms of He-II photons while not leaving the blue zone in terms of Lyman photons. For more details on the population synthesis and spectral hardness, see Sects. 2.3 and 3.2, respectively.
Current usage metrics show cumulative count of Article Views (full-text article views including HTML views, PDF and ePub downloads, according to the available data) and Abstracts Views on Vision4Press platform.
Data correspond to usage on the plateform after 2015. The current usage metrics is available 48-96 hours after online publication and is updated daily on week days.
Initial download of the metrics may take a while.