| Issue |
A&A
Volume 703, November 2025
|
|
|---|---|---|
| Article Number | A50 | |
| Number of page(s) | 8 | |
| Section | Stellar structure and evolution | |
| DOI | https://doi.org/10.1051/0004-6361/202452522 | |
| Published online | 05 November 2025 | |
The origin of the luminous blue variable Wray 15–0751⋆
1
European Southern Observatory, Karl-Schwarzschild-Str. 2, D-85748 Garching bei München, Germany
2
Astronomisches Rechen-Institut, Zentrum für Astronomie der Universität Heidelberg, Mönchhofstrasse 12-14, D-69120 Heidelberg, Germany
3
Visiting Scientist, European Southern Observatory, Av. Alonso de Córdova 3107, Santiago, Chile
⋆⋆ Corresponding author: This email address is being protected from spambots. You need JavaScript enabled to view it.
Received:
7
October
2024
Accepted:
25
August
2025
Abstract
Context. Luminous blue variables (LBVs) are an elusive stage of the post-main sequence evolution of massive stars. Wray 15−0751 is one of the few LBVs known to belong to a cluster, FSR 1570, to which we can constrain the distance and kinematics thanks to Gaia, providing additional valuable information of the star.
Aims. We jointly consider the Gaia astrometric information on Wray 15−0751 and its cluster, plus its spectral classification and that of the brightest cluster members, to assess the evolutionary path leading to the current stage of the star and infer some properties of the likely binary system that originated it.
Methods. In addition to the astrometry from Gaia DR3 we present classification spectroscopy in the visible of Wray 15−0751 and the 18 brightest cluster members of FSR 1570, plus new photometric and spectroscopic observations of Wray 15−0751, which we analyzed jointly with published evolutionary tracks.
Results. Astrometry confirms the membership of Wray 15−0751 in its host cluster, without displaying any evidence of a kick velocity. The current cluster turnoff at late O types implies an age of 10.2+6.3−3.2 Myr. Together with the results of existing far-infrared observations pointing to it having recently undergone the red supergiant phase, we conclude that Wray 15−0751 is most likely a blue straggler now in the blue loop, resulting from a complete merger of two members of a close binary system with similar initial masses, not much in excess of ∼20 solar masses each.
Key words: blue stragglers / stars: early-type / stars: individual: Wray 15–0751
Based on observations collected with the New Technology Telescope and on archive observations collected with the Very Large Telescope at the European Organisation for Astronomical Research in the Southern Hemisphere (ESO) under programme IDs 0111.D-0386(A) and 077.D-0100(A), respectively.
© The Authors 2025
 Open Access article, published by EDP Sciences, under the terms of the Creative Commons Attribution License (https://creativecommons.org/licenses/by/4.0), which permits unrestricted use, distribution, and reproduction in any medium, provided the original work is properly cited.
This article is published in open access under the Subscribe to Open model. This email address is being protected from spambots. You need JavaScript enabled to view it. to support open access publication.
1. Introduction
The post-main sequence evolution of the most massive stars contains substantial uncertainties. Mass loss through stellar winds, pulsational instabilities, the consequences of rotation, and the impact of close binarity are all important and often decisive effects, but are difficult to introduce in models in an accurate manner. Observationally, the scarcity of the most massive stars, their short lifetimes, and their often poorly known distance to us limit the size and quality of the samples of such objects. Examples of the different phases under which such massive stars appear in their transition from the main sequence to the final core collapse are recognized, but their chronological sequence is still disputed.
Luminous blue variables (LBVs) are a rare class of post-main sequence massive stars in a particular phase of such a transition, characterized by a high surface temperature (Teff ∼ 1 − 3 × 10⁴ K), a high luminosity (log L/L⊙ > 5), a spectroscopic and photometric variability of a few magnitudes on characteristic timescales of several years but without a definitive periodicity (Spejcher et al. 2025), and often with nebulae that testify to periods of intense mass loss (Ṁ ∼ 10−3−10−4 M⊙/yr), currently or in the recent past (Nota et al. 1995; Nota 2004; van Genderen 2001). Their rotation is generally fast (Groh et al. 2009). Their relationship to other stages of massive star evolution is not clear, in particular whether they have gone through the red supergiant phase (van Genderen 2001; Vamvatira-Nakou et al. 2013) or are on their way to it (Morris et al. 1996; Lamers et al. 2001; Oksala et al. 2013), and the possibility exists that the pre- or post-red giant occurrence of the LBV phase is dependent on the mass (Clark et al. 2011). Furthermore, Smith & Tombleson (2015) note that LBVs are often found in isolation, suggesting that for many of them the supernova explosion of a close companion results in a large kick velocity of the present LBV, eventually leaving its parental cluster, thus linking the LBV phase to close binarity. On the other hand binarity is common among LBVs, and it could reach 100% (Mahy et al. 2022). Short period binaries are excluded because of the large radii of LBVs (100−650 R⊙).
Wray 15−0751 was first identified by Roberts (1962) as a possible Wolf-Rayet star, and included by Wray (1966) in his catalog of Hα emitting objects in the Milky Way. Hu et al. (1990) spectroscopically confirmed it as a LBV, and its light curve, mainly in the 1985−2008 period, was summarized by Sterken et al. (2008). Its distance remained poorly determined until the advent of the Gaia DR3 catalog. In the meantime a distant cluster, Teutsch 143a, had been reported by Dias et al. (2002) in their catalog of open clusters and candidates in positional coincidence with Wray 15−0751. The cluster was found by Pasquali et al. (2006) to contain O and B stars surrounding Wray 15−0751, and it was confirmed by Froebrich et al. (2008) as FSR 1570. The membership of Wray 15−0751 offered valuable possibilities for the study of the age and evolutionary path by comparison to the Hertzsprung-Russell diagram of the cluster (Clark et al. 2011). Nevertheless, spectral classification of only limited quality was available for a few cluster stars; their distance was uncertain, and even the actual membership of Wray 15−0751 in that cluster was put in doubt by Smith & Tombleson (2015).
Here we present improved quality spectra of a larger number of cluster stars, which are now complemented with Gaia DR3 data, more firmly establishing the distance both to Wray 15−0751 and to the cluster, as well as their proper motions. We also discuss spectra of Wray 15−0751 present in the ESO science archive. Our results confirm Wray 15−0751 as a member of the cluster, many of whose brightest members are already evolving out of the main sequence, which suggests that Wray 15−0751 is a blue straggler. The spatial coincidence and the lack of a significant tangential velocity with respect to the cluster both suggest that the events giving rise to Wray 15−0751 have not resulted in any significant kick velocity. Together with its characteristics that reveal its history within the last tens of thousands of years (Vamvatira-Nakou et al. 2013), Wray 15−0751 thus appears as a particularly interesting LBV able to provide useful clues about an elusive stage of massive star evolution.
2. The FSR 1570 cluster
2.1. Spectroscopy
A region of 7′×7′ centered on the position of Wray 15−0751 was imaged through the UBV filters by Pasquali et al. (2006). They found that the stars with U − B, B − V colors characteristic of very early-type stars independent of their reddening were almost exclusively concentrated in an area of 1′ radius containing Wray 15−0751. The spectroscopy of five of these starsconfirmed their classification as late O and early B stars, including some that probably belong to luminosity class I. Although suggestive of a rather old cluster with late O-type stars already evolving past the main sequence, both the small number of stars with spectral classification and the limited signal-to-noise ratio of the spectra made the conclusion only tentative. Later on, infrared imaging by Froebrich et al. (2008) confirmed the cluster, denominated as FSR 1570, but its age remained very uncertain,  Myr.
Myr.
The ESO science archive contains as-yet-unpublished spectroscopic observations of as many as 18 stars in the cluster, with improved quality, enabling a more reliable classification of most of its earliest members. The observations were obtained on the night of 19−20 April 2006 with the FORS1 instrument at the Very Large Telescope (VLT) in the movable slits mode. Due to the instrumental constraints in the positions of the slits and the small area of the sky containing the stars, observations in four different slit configurations were made. The exposure times were 4 × 1800 s in each configuration. A grism was used providing a spectral resolution R = 1420 with a 1″ slit, covering a wavelength range that was somewhat variable depending on the location of each star, but containing in all cases the 3900−4500 Å region, where the most relevant classification criteria for these stars are found.
These stars are found within a relatively narrow range of Gaia GBP − GRP colors, as shown in Figure 1. Wray 15−0751 is far brighter, and its color is similar to that of the other stars although somewhat redder. The spectra of the 18 stars observed are displayed in Figure 2. The classification, presented in Table 1 together with astrometric and photometric data from Gaia DR3, is based on the atlas of Walborn & Fitzpatrick (1990), using a similar spectral range and resolution. All the stars are classified as late O and early B types, with lines of HeI clearly visible in all of the spectra. Late O stars also show HeII lines, although with less prominence than HeI. Uncertainties are estimated to be 0.5 spectral subclasses for O stars based on the HeII/HeI line ratios, and one spectral subclass for B stars. The luminosity class is generally well established for stars in the main sequence and is uncertain by one luminosity class outside it, except in the few cases where this is explicitly indicated in Table 1.
Cluster members spectroscopically observed.
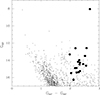 |
Fig. 1. Gaia GBP, GRP color-magnitude diagram of the stars within a 1′ angular distance from Wray 15−0751. The 18 cluster stars selected on the basis of their UBV colors in Pasquali et al. (2006) are marked with back circles, as is Wray 15−0751 which is the bright star at the top right of the diagram. Gaia DR3 observations covered the period 2014−2017, during the late S Dor phase of Wray 15−0751, as noted in Section 3, and its magnitude was declining toward quiescence, while its color was becoming gradually bluer. |
 |
Fig. 2. Spectra of the 18 observed members of the Wray 15−0751 cluster. |
The earliest stars in our sample are J110848.92−604422.5 and J110837.00−604244.5. The first has a rather high transversal velocity with respect to the rest of the stars in the cluster, as further discussed in Section 2.2, with a relative proper motion exceeding 1 mas yr−1. Its position in the outskirts of the cluster indicates that it is moving away from it. In thus seems to be a moderate runaway star, perhaps resulting from the supernova explosion of a more massive companion or from dynamical interactions in a close multiple system. However, the possibility that it may not be an actual cluster member that is lying at a sensibly different distance, cannot be completely ruled out. The second star, J110837.00−604244.5, is the brightest after Wray 15−0751. The luminosity classes of both stars are markedly different, as clearly shown by the prominence of SiIV features around Hδ in J110837.00−604244.5, which are nearly absent in J110848.92−604422.5. The spectrum of J110837.00−604244.5 is shown in more detail in Figure 3, where the main features are noted. In the spectra of both stars the HeII features at 4200, 4541, and 4686 Å are clearly seen, but are not dominant with respect to the numerous lines due to HeI. In particular, the HeI 4471/HeII 4541 ratio is a good spectral subtype indicator among late O-type stars. The relative intensities of HeI and HeII and the intensity of the SiIV lines with respect to Hδ lead us to classify these stars as O8III-V (J110848.92−604422.5) and O8.5Ia (J110837.00−604244.5).
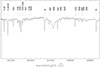 |
Fig. 3. Spectrum of J110837.00−604244.5, the brightest and earliest-type star of the FSR 1570 cluster, with its main spectral features marked. |
We estimated the extinction toward each star using the Gaia GBP − GRP color and the intrinsic (V − Ic)0 for stars of different luminosity classes by Currie et al. (2010), which we converted to the intrinsic (GBP − GRP)0 using the general transformation (GBP − GRP) = − 0.03298 + 1.259(V − IC)−0.1279(V − IC)2 + 0.01631(V − IC)3 from Carrasco & Bellazzini1}. We then calculate the extinction as AV = 2.396[(GBP − GRP)−(GBP − GRP)0] (Wang & Chen 2019; Comerón et al. 2022). We have not calculated the extinction of Wray 15−0751 is this way, due to the likely spectral evolution of the star during the period covered by Gaia measurements (2014−2017) and the uncertain contribution of the Hα flux during this period, which would affect both GBP and, especially, GRP. We consider this in more detail in Section 4.1.
2.2. Distance and cluster membership
All the selected cluster members have been observed by Gaia, and their parallaxes and proper motions, available in version 3 of its data release (DR3), are listed in Table 1. We also list the Gaia DR3 parallax and proper motion of Wray 15−0751. With only two exceptions, also showing somewhat deviating proper motions, the astrometric solutions for all the stars including Wray 15−0751 are of good quality, as shown by their renormalized unit weight error (RUWE) below the 1.4 threshold (Lindegren et al. 2021). We estimated the astrometric parallax of the cluster as ϖ = (∑iϖi/σ(ϖ)i)/(∑i1/σ(ϖ)i) excluding the stars J110842.38−604248.5 and J110844.44−604250.5, which have RUWE > 1.4.
The value thus obtained needs to be corrected by the zero-point offset known to affect Gaia parallaxes. This has been examined in detail by Lindegren et al. (2021), who show that such a correction depends in a complex way on parameters such as magnitude, color, and position in the sky, and that the precise value of the correction may vary over small angular scales. In general, zero points derived from quasars show the correction to be around −0.02 mas over the entire sky (where the negative sign means that corrected parallaxes are higher, and the distance correspondingly lower), with more negative values closer to −0.03 mas for brighter objects (Gaia G magnitude brighter than ≃18), in principle more appropriate for our sources. However, quasars observed by Gaia are in general bluer, and rarely redder than GBP − GRP ≃ 1.6, while our sources have redder GBP − GRP, therefore making the color-dependent correction to Gaia parallaxes based on quasars uncertain. On the other hand, the correction including samples in the Large Magellanic Cloud considered by Lindegren et al. (2021) lies at very different coordinates, and that using close pairs is limited to bright magnitudes, and thus should be used with caution when applied to our targets. We adopted a parallax zero-point offset of −0.03, consistent with the general correction of bright quasars and found to be appropriate for reddened stars in the l = 265° −275° interval near the galactic plane (Drew et al. 2021), which is 15° away from our region but otherwise has a similar galactic and ecliptic latitude. The distance to the cluster, obtained by averaging the parallaxes of its members as described earlier, is 8.4 ± 0.4 kpc, consistent with the Gaia DR3 distance of  kpc of Wray 15−0751.
The uncertainties in individual distances, generally much larger than the uncertainty in the adopted distance of the cluster, might not exclude in principle the possibility that the stars are actually distributed in more than one cluster, or that some of them are located in front or behind the cluster, actually covering a range of significantly different distances. This would make their apparent positional coincidence with FSR 1570 the result of a casual alignment along the line of sight. We note however that the rotation curve of the galaxy implies a gradient of proper motions of approximately 0.3 mas yr−1 kpc−1 at the galactic longitude and adopted distance of FSR 1570. The very similar proper motions of the 18 stars listed in Table 1 therefore implies that they are all located within a short range of distances, thus favoring their allocation to a single cluster. Possible exceptions to this are the O8III-V star J110848.92−604422.5, discussed before, and J110842.38−604248.5, a star with a poor astrometric solution whose proper motion differs by more than 4 mas yr−1 from the adopted cluster proper motion.
The proper motion of Wray 15−0751 is also in very good agreement with the proper motion of the cluster. Excluding the two stars with high RUWE and J110848.92−604422.5, the average proper motion of the cluster stars is (μα cos δ, μδ) = (−5.729, 2.160) mas/yr, which translates to only 3.5 ± 1.3 km s−1 of difference with the tangential velocity of Wray 15−0751 assuming a common distance of 8.4 ± 0.4 kpc, supported by the compatibility of Gaia DR3 parallax and the coincidence of proper motions. We therefore also adopt for Wray 15−0751 the cluster distance of 8.4 ± 0.4 kpc.
3. Recent Wray 15–0751 activity
In recent years Wray 15−0751 has undergone one of the S Dor phases (van Genderen 2001) of enhanced brightness characteristic of LBVs, mainly due to a radial expansion together with a decrease in surface temperature. A historical record of the photometric behavior of Wray 15−0751 is presented by Sterken et al. (2008); it extends for several decades until the start of the recent S Dor phase, which began around the end of 2006, reaching V ≃ 10.5. A more recent light curve presented by Mahy et al. (2022) shows that the peak lasted until late 2014, after which a slow decline followed, becoming faster with time until their latest reported date in 2019, when V = 12 was reached. The brighter phase coincided as expected with a reddening in B − V comparing the observations by van Genderen et al. (1992) and Sterken et al. (2008).
We obtained BVRC photometry and long-slit spectroscopy of Wray 15−0751 on the night of 26−27 February 2024 using the EFOSC2 instrument at the ESO New Technology Telescope at the Observatory of La Silla, Chile. Three images were obtained through each filter having total exposure times of 180, 45, and 9 seconds, respectively. Low-resolution spectroscopy was obtained using a grism covering the 3860 to 8070 Å range and yielding a resolution R = 200 with the 1″ slit used. The spectrum, shown in Figure 4, is dominated by emission lines of FeII and [FeII]. Also visible are Hβ and the HeI line at 5876 Å, and especially a very strong Hα emission as noted in Section 2. Our photometry shows that the magnitude (B = 13.90, V = 12.07, RC = 11.09) had returned to its typical pre-brightening value at that time. Comparing the fluxes in B and V with and without clipping the emission lines in those bands we measure the contribution of the emission lines to the B and V magnitudes to be only 0.03 and 0.02 magnitudes, respectively, despite their prominence in the spectra. The color of the star, B − V = 1.83, also appears to be somewhat bluer than during the S Dor phase (Sterken et al. 2008), pointing toward an earlier spectral type than during that phase, as discussed in Section 4.1.
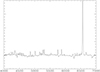 |
Fig. 4. Low-resolution spectrum of Wray 15−0751 in quiescent phase, in February 2024, normalized to the continuum. Apart from the very prominent Hα emission, numerous emission lines are seen mostly due to FeII and [FeII]. The absorption features near 4430 Å, 5780 Å, and 6280 Å are caused by diffuse absorption bands along the line of sight. |
4. Discussion
4.1. The spectral type of Wray 15–0751
A tentative spectral classification as O9.5I of Wray 15−0751 was derived by Hu et al. (1990) and was adopted in other works. That classification used low-resolution spectroscopy heavily affected by emission lines; it was based on a fit to the general spectral energy distribution and the extinction, resulting in a very imprecise spectral classification. Likewise, our recent spectrum in Figure 4 is poorly suited for this purpose due to the obliteration of photospheric features by the abundant emission lines and the low spectral resolution available. Nevertheless, a series of echelle spectra of Wray 15−0751 were obtained with the HARPS and FEROS spectrographs at the ESO 3.6m and ESO-MPG 2.2m telescopes, respectively, between February 2008 and May 2015, during the most recent S Dor phase. These spectra were retrieved from the ESO archive. During this time abundant FeI lines appeared in absorption only, and the photospheric features used for spectral classification were easily measured. Figure 5 shows one of these spectra, obtained with HARPS on 17 February 2008, more than one year into the S Dor phase. Only the range between 4000 Å and 5200 Å is displayed, containing relevant classification features as well as very numerous FeI lines in absorption. Other lines between 4100 Å and 4700 Å, in addition to very narrow Hδ and Hγ with a P Cygni profile, are SiII at 4128 Å and 4130 Å, and a fairly strong MgI feature at 4481 Å, simultaneous with the absence of the neighbouring line of HeI at 4471 Å. No evidence of any other HeI and HeII lines appears. A very similar HARPS spectrum obtained one year later, on 9 February 2009, shows the same features. However, the final high-resolution spectrum in this series obtained on 14 May 2015, already during the transition toward the quiescent phase, does show HeI features as well as reverse P Cygni profiles in the H and FeII lines.
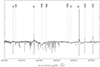 |
Fig. 5. Spectrum of Wray 15−0751 obtained with the HARPS instrument on 17 February 2008, more than one year into the most recent S Dor phase, normalized to the continuum. The vast majority of the lines are due to FeI. The MgI feature at 4481 Å is rather prominent while the neighbouring HeI line at 4471 Å is altogether absent. Other HeI and HeII lines in this wavelength range are also not present. |
We used the criteria proposed by Gray & Corbally (2009) and Huo et al. (2024) to estimate the spectral type in the S Dor phase, using the spectrum of Wray 15−0751 obtained on 17 February 2008. The absence of helium lines, at the same time as the absence of CaI line at 4226 Å, indicates an A-type spectrum. The spectral subtype can be estimated by comparing the strengths of the FeII–TiII feature at 4172 Å and the feature at 4179, which we find to be very similar in our spectrum. On the other hand, the MgII line at 4481 Å is similar in strength to FeII at 4582 Å which indicates a spectral type in the A5−A7 range. This implies an intrinsic (B − V)0 color in the 0.09−0.13 range (Drilling & Landolt 2000), leading to AV = 3.1((B − V)−(B − V)0)≃6.1 − 6.0 using a reddened (B − V) = 2.05 on those dates (Sterken et al. 2008), in good agreement with the range of extinctions for the stars in the FSR 1570 cluster presented in Table 1. On the other hand, we measure (B − V) = 1.83 in February 2024, already in the quiescent phase, thus indicating an intrinsic color (B − V)0 between −0.13 and −0.09, which corresponds to a spectral type around B5 in that phase. This spectral type, together with our measured magnitude V = 12.07 in February 2024 and the adopted distance of the FSR 1570 cluster hosting Wray 15−0751, indicates a luminosity of log L/L⊙ ≃ 5.7 in the quiescent phase.
We note that active LBVs near quiescence tend to define a sequence characterized by the linear relationship log L/L⊙ = 1.37 log Teff − 0.03 (van Genderen 2001). Wray 15−0751 was suspected to be an outlier, but the new constraints derived from Gaia astrometry, membership in the cluster, and a later spectral type than assumed in earlier works brings it to a much better agreement with that relationship. We find that a B5 spectral type, with Teff = 13 600 K (Drilling & Landolt 2000), yields log L/L⊙ = 5.63 according to that sequence, which is in good agreement with the derived luminosity of Wray 15−0751.
4.2. Evolutionary state and implications on the precursor to Wray 15–0751
The additional information provided by the Wray 15−0751 host cluster allows us to further constrain the properties and history of the LBV. It is difficult however to determine precisely the age of FSR 1570 from the turnoff point of the main sequence due to a number of factors such as the influence of the rotational velocity of each star on its lifetime in the main sequence (Ekström et al. 2012), the possible impact of binarity, or the limited number of stars tracing the turnoff of the main sequence of the cluster. This is contributed by modeling uncertainties such as the treatment of overshooting in the radiation-convection layer, rotation, or the history of mass loss of the stars (Berlanas et al. 2025).
We find that all the O stars of FSR 1570 are already evolving away from the main sequence, with the possible exceptions of J110848.92−604422.5 and J110840.59−604232.6, both of which have spectra of insufficient quality for a precise determination of the luminosity class. In addition we have already noted the higher proper motion of the O8 star J110848.92−604422.5, which makes it a runaway star of moderately high velocity, if it is indeed a member of the cluster. If its runaway velocity is the result of a close interaction in a multiple system, it is probable that there have been episodes of mass transfer with its companion affecting its evolutionary path that prevents us from using this star to define the turnoff of the cluster main sequence. On the other hand, most of the early B stars of the cluster are found to remain in the main sequence, including J110840.93−604316.2 and J110841.69−604254.9, which we classify as B0V. We have therefore adopted an approximate main sequence turnoff around spectral type O9.5, with an estimated uncertainty of one spectral subclass, corresponding to a temperature Teff = 32000 ± 4000 K (Drilling & Landolt 2000). This corresponds to an age of  Myr according to Yusof et al. (2022) stellar models with solar metallicity, where the lower and upper limits correspond respectively to the cases of a nonrotating star with Teff = 36 000, and a star rotating with 40% of the critical velocity and Teff = 28 000 K. A comparison with the evolutionary models of massive stars of solar metallicity of Brott et al. (2011) gives similar results: at 20 M⊙ the difference in main sequence duration between the two sets of models is within 0.5 Myr; Yusof et al. (2022) predicted a shorter duration for nonrotating stars and a longer one for rotating stars with 40% of the critical velocity. The differences are somewhat larger for lower masses, where Yusof et al. (2022) predicted durations shorter by 1.2 Myr for nonrotating stars of 12 M⊙, and longer by 0.8 Myr for rotating stars of the same mass. A comparison of the two sets of models shows that the mass lost in stellar winds during the main sequence duration is about 0.3 M⊙–0.5 M⊙ at 20 M⊙ in Yusof et al. (2022), the higher value corresponding to a rotating star, and less than 0.1 with and without rotation at 12 M⊙. The corresponding mass loss is approximately twice those values in the Brott et al. (2011) models.
The age of FSR 1570 makes Wray 15−0751 a very likely blue straggler of the cluster. Using Yusof et al. (2022) models, a pre-red supergiant with a luminosity log(L/L⊙) = 5.7 would imply an initial mass M = 37 ± 4 M⊙ for an isolated star, and an even higher mass, M ≃ 40 ± 4 M⊙, if that luminosity were attained in the blue loop, post-red supergiant phase. Again, the error bar corresponds to the assumed range of possible initial rotation velocities of the star. The corresponding lifetime of such a massive star would then be 5.3 ± 1 Myr, difficult to reconcile with the age of FSR 1570 discussed above if Wray 15−0751 had evolved in isolation. This leads to the alternative scenario of an initial close binary system having undergone substantial mass transfer, or probably a complete merger, as the precursor of the LBV. Any noticeable kick velocity resulting from the supernova explosion of the close companion, suspected to lie at the origin of many LBVs (Smith & Tombleson 2015), is ruled out in the case of Wray 15−0751 by the very small difference between its tangential velocity with respect to that of the cluster, implying that most or all of the mass of the companion would have been accreted in the merger.
In general, the history of mass transfer between the two components of a close binary depends primarily on the initial mass of each component and the initial separation between them (Vanbeveren et al. 1998), but we can still infer some details on the pre-LBV history of Wray 15−0751. In their detailed study of the far-infrared nebula around of Wray 15−0751, Vamvatira-Nakou et al. (2013) found evidence that the star had already undergone the red supergiant phase from the enhanced N/H ratio of its outer parts ejected during that phase, together with depleted C/H and O/H ratios. They show that the red supergiant phase took place very recently, obtaining a kinematic age of ∼105 years for the nebula, corrected here for the somewhat larger distance that we find compared to the one adopted in that work. They also estimate the mass of the star to have been around 40 M⊙, a result that is in very good agreement with the value that we find based on the current luminosity of Wray 15−0751 assuming it to be in the post-red supergiant phase.
We can obtain further constraints on the pre-LBV history of Wray 15−0751 by combining its recent transition to the red supergiant stage, its present high luminosity, and the age of the cluster. The estimated turnoff of the cluster main sequence, as discussed above, corresponds to an approximate mass of ∼20 M⊙, or approximately half of the pre-red supergiant mass of the LBV precursor as discussed above. Neither of the stars of the binary leading to the current LBV could have been substantially more massive than the cluster turnoff mass during their previous evolution, as otherwise the LBV phase would have already been completed before the present time. For the same reason, we estimate the merger leading to the LBV precursor to have taken place rather recently. This leads us to conclude that the precursor binary system was most likely composed of two stars of similar initial masses, having merged in the recent past. Binary systems with components of similar mass are in fact the most commonly encountered initial configuration for massive stars (Sana 2017).
5. Summary and conclusions
The combination of new Gaia data on Wray 15−0751 and its host cluster, and the spectral typing of the 18 brightest cluster members, allows us to reassess some intrinsic properties of this star, its origin, and it evolutionary history. We can summarize our finding as follows:
-
The membership of Wray 15−0751 in the FSR 1570 cluster is confirmed through the new information available in Gaia DR3. The distance to the cluster is found to be 8.4 ± 0.4 kpc, and the individual trigonometric parallax of Wray 15−0751, resulting in a distance of
 kpc, is compatible with this determination. Likewise the proper motion of the cluster, (μα cos δ, μδ) = (−5.729, 2.169) mas yr−1, is found to imply a tangential velocity of only 3.5 ± 1.2 km s−1 with respect to Wray 15−0751. The average reddening toward the cluster is similar to that toward Wray 15−0751.
 -
The upper main sequence of the Wray 15−0751 host cluster is found to contain late O-type stars that have already evolved out of the main sequence, the earliest types being a O8III-V and a O8.5Ia star. The evolutionary tracks indicate a cluster age of
 Myr from the estimated turnoff of the main sequence.
 -
Wray 15−0751 started a S Dor phase of enhanced brightness starting in late 2006, which probably lasted until 2019. We find that the star was indeed in the quiescent phase in February 2024, displaying now a somewhat bluer color than during the enhanced brightness phase.
-
Using archive high-resolution spectroscopy of Wray 15−0751 obtained in 2008−2015, during the S Dor phase, we classify its spectral type as A5−A7. Comparing its (B − V) color in that phase to the bluer one measured in 2024 we estimate its spectral type to be B5 in the quiescent state.
-
A comparison with the host cluster FSR 1570 shows Wray 15−0751 to be a likely blue straggler. In the most likely scenario, Wray 15−0751 would be the result of the relatively recent complete or nearly complete merger of a precursor close binary, composed of two stars of similar mass, each of them having a mass close to ∼20 M⊙.
The question remains of how typical the described evolutionary path that we have inferred for Wray 15−0751 is for other luminous blue variable stars. The evidence discussed by Smith & Tombleson (2015) in favor of the origin of these stars being frequently linked to the supernova explosion of a close companion, thus accounting for their isolation, suggests that the evolutionary path followed by Wray 15−0751, resulting in a merger rather that the explosion of the companion, may not be very common. On the other hand, the finding by Mahy et al. (2022) that many (and probably all) LBVs are in multiple systems at present seems to be in tension with Smith & Tombleson (2015) conclusion, unless such objects are usually born in tertiary or even higher order systems. Further observations of other LBVs and their environments, together with a more precise characterization of their properties thanks to the improved astrometry provided by Gaia, will be helpful in this respect. However, results such as those presented here already suggest that there may not be a single path resulting in LBVs, and that their place in the post-main sequence evolutionary sequence of massive stars may well vary from object to object.
Acknowledgments
Comments by two anonymous referees have greatly contributed to improve this paper. The support of the staff at the La Silla observatory during the performance of our observations in February 2024 is gratefully acknowledged. This work presents results from the European Space Agency (ESA) space mission Gaia. Gaia data are being processed by the Gaia Data Processing and Analysis Consortium (DPAC). Funding for the DPAC is provided by national institutions, in particular the institutions participating in the Gaia MultiLateral Agreement (MLA). This research has made use of the SIMBAD database and the VizieR catalog service, both operated at CDS, Strasbourg, France.
References
- Berlanas, S. R., Mahy, L., Herrero, A., et al. 2025, A&A, 695, A248 [NASA ADS] [CrossRef] [EDP Sciences] [Google Scholar]
- Brott, I., de Mink, S. E., Cantiello, M., et al. 2011, A&A, 530, A115 [NASA ADS] [CrossRef] [EDP Sciences] [Google Scholar]
- Clark, J. S., Arkharov, A., Larionov, V., et al. 2011, Bull. Soc. Roy. Sci. Liege, 80, 361 [Google Scholar]
- Comerón, F., Djupvik, A. A., & Schneider, N. 2022, A&A, 665, A76 [NASA ADS] [CrossRef] [EDP Sciences] [Google Scholar]
- Currie, T., Hernandez, J., Irwin, J., et al. 2010, ApJS, 186, 191 [NASA ADS] [CrossRef] [Google Scholar]
- Dias, W. S., Alessi, B. S., Moitinho, A., & Lépine, J. R. D. 2002, A&A, 389, 871 [NASA ADS] [CrossRef] [EDP Sciences] [Google Scholar]
- Drew, J. E., Monguió, M., & Wright, N. J. 2021, MNRAS, 508, 4952 [NASA ADS] [CrossRef] [Google Scholar]
- Drilling, J. S., & Landolt, A. U. 2000, in Allen’s Astrophysical Quantities, ed. A. N. Cox, 381 [Google Scholar]
- Ekström, S., Georgy, C., Eggenberger, P., et al. 2012, A&A, 537, A146 [Google Scholar]
- Froebrich, D., Meusinger, H., & Scholz, A. 2008, MNRAS, 390, 1598 [NASA ADS] [Google Scholar]
- Gray, R. O., Corbally, J. C., 2009, Stellar Spectral Classification (Princeton: Princeton University Press) [Google Scholar]
- Groh, J. H., Damineli, A., Hillier, D. J., et al. 2009, ApJ, 705, L25 [NASA ADS] [CrossRef] [Google Scholar]
- Hu, J. Y., de Winter, D., The, P. S., & Perez, M. R. 1990, A&A, 227, L17 [Google Scholar]
- Huo, Z., Liu, Z., Liu, J., et al. 2024, MNRAS, 531, 1244 [Google Scholar]
- Lamers, H. J. G. L. M., Nota, A., Panagia, N., Smith, L. J., & Langer, N. 2001, ApJ, 551, 764 [NASA ADS] [CrossRef] [Google Scholar]
- Lindegren, L., Bastian, U., Biermann, M., et al. 2021, A&A, 649, A4 [EDP Sciences] [Google Scholar]
- Mahy, L., Lanthermann, C., Hutsemékers, D., et al. 2022, A&A, 657, A4 [NASA ADS] [CrossRef] [EDP Sciences] [Google Scholar]
- Morris, P. W., Eenens, P. R. J., Hanson, M. M., Conti, P. S., & Blum, R. D. 1996, ApJ, 470, 597 [Google Scholar]
- Nota, A. 2004, IAU Symp., 215, 491 [Google Scholar]
- Nota, A., Livio, M., Clampin, M., & Schulte-Ladbeck, R. 1995, ApJ, 448, 788 [Google Scholar]
- Oksala, M. E., Kraus, M., Cidale, L. S., Muratore, M. F., & Borges Fernandes, M. 2013, A&A, 558, A17 [NASA ADS] [CrossRef] [EDP Sciences] [Google Scholar]
- Pasquali, A., Comerón, F., & Nota, A. 2006, A&A, 448, 589 [NASA ADS] [CrossRef] [EDP Sciences] [Google Scholar]
- Roberts, M. S. 1962, AJ, 67, 79 [Google Scholar]
- Sana, H. 2017, IAU Symp., 329, 110 [Google Scholar]
- Smith, N., & Tombleson, R. 2015, MNRAS, 447, 598 [NASA ADS] [CrossRef] [Google Scholar]
- Spejcher, B., Richardson, N. D., Pablo, H., et al. 2025, AJ, 169, 128 [Google Scholar]
- Sterken, C., van Genderen, A. M., Plummer, A., & Jones, A. F. 2008, A&A, 484, 463 [NASA ADS] [CrossRef] [EDP Sciences] [Google Scholar]
- Vamvatira-Nakou, C., Hutsemékers, D., Royer, P., et al. 2013, A&A, 557, A20 [NASA ADS] [CrossRef] [EDP Sciences] [Google Scholar]
- van Genderen, A. M. 2001, A&A, 366, 508 [NASA ADS] [CrossRef] [EDP Sciences] [Google Scholar]
- van Genderen, A. M., The, P. S., de Winter, D., et al. 1992, A&A, 258, 316 [Google Scholar]
- Vanbeveren, D., De Donder, E., Van Bever, J., Van Rensbergen, W., & De Loore, C. 1998, New Astron., 3, 443 [CrossRef] [Google Scholar]
- Walborn, N. R., & Fitzpatrick, E. L. 1990, PASP, 102, 379 [Google Scholar]
- Wang, S., & Chen, X. 2019, ApJ, 877, 116 [Google Scholar]
- Wray, J. D. 1966, Ph.D. Thesis, Northwestern University [Google Scholar]
- Yusof, N., Hirschi, R., Eggenberger, P., et al. 2022, MNRAS, 511, 2814 [NASA ADS] [CrossRef] [Google Scholar]
All Tables
All Figures
|
Fig. 1. Gaia GBP, GRP color-magnitude diagram of the stars within a 1′ angular distance from Wray 15−0751. The 18 cluster stars selected on the basis of their UBV colors in Pasquali et al. (2006) are marked with back circles, as is Wray 15−0751 which is the bright star at the top right of the diagram. Gaia DR3 observations covered the period 2014−2017, during the late S Dor phase of Wray 15−0751, as noted in Section 3, and its magnitude was declining toward quiescence, while its color was becoming gradually bluer. |
| In the text | |
|
Fig. 2. Spectra of the 18 observed members of the Wray 15−0751 cluster. |
| In the text | |
|
Fig. 3. Spectrum of J110837.00−604244.5, the brightest and earliest-type star of the FSR 1570 cluster, with its main spectral features marked. |
| In the text | |
|
Fig. 4. Low-resolution spectrum of Wray 15−0751 in quiescent phase, in February 2024, normalized to the continuum. Apart from the very prominent Hα emission, numerous emission lines are seen mostly due to FeII and [FeII]. The absorption features near 4430 Å, 5780 Å, and 6280 Å are caused by diffuse absorption bands along the line of sight. |
| In the text | |
|
Fig. 5. Spectrum of Wray 15−0751 obtained with the HARPS instrument on 17 February 2008, more than one year into the most recent S Dor phase, normalized to the continuum. The vast majority of the lines are due to FeI. The MgI feature at 4481 Å is rather prominent while the neighbouring HeI line at 4471 Å is altogether absent. Other HeI and HeII lines in this wavelength range are also not present. |
| In the text | |
Current usage metrics show cumulative count of Article Views (full-text article views including HTML views, PDF and ePub downloads, according to the available data) and Abstracts Views on Vision4Press platform.
Data correspond to usage on the plateform after 2015. The current usage metrics is available 48-96 hours after online publication and is updated daily on week days.
Initial download of the metrics may take a while.