Fig. 11
Download original image
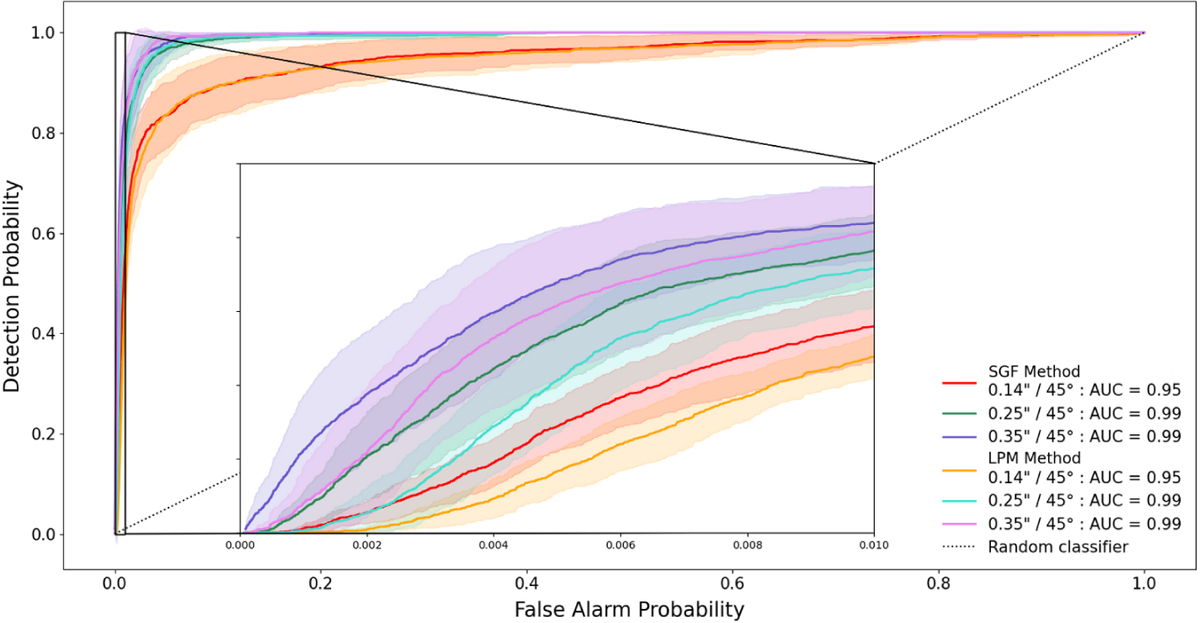
Bundle of ROC curves, for both halo subtraction methods, and for various fake planet injections separations; a zoom for FAP between 0 and 10−2 is included. The random classifier, which validates or invalidates detections with the same probability of 0.5 is shown as a dotted diagonal line for comparison. AUC stands for area under the curve; by definition, the AUC of the random classifier is equal to 0.5. Contrast curves are located on ROC curves at DP = 0.5 (and 0.25 and 0.75 to built error margins as in Fig. 10 for example) and FAP = 2.87 × 10⁻⁷ (corresponding to a 5-σ confidence interval). Data is lacking to produce an accurate curve, especially around FAP = 2.87 × 10⁻⁷, but this still shows that, within the 1-σ margin of error, the two stellar halo subtraction methods have relatively equivalent overall robustness as well.
Current usage metrics show cumulative count of Article Views (full-text article views including HTML views, PDF and ePub downloads, according to the available data) and Abstracts Views on Vision4Press platform.
Data correspond to usage on the plateform after 2015. The current usage metrics is available 48-96 hours after online publication and is updated daily on week days.
Initial download of the metrics may take a while.