Fig. A.1
Download original image
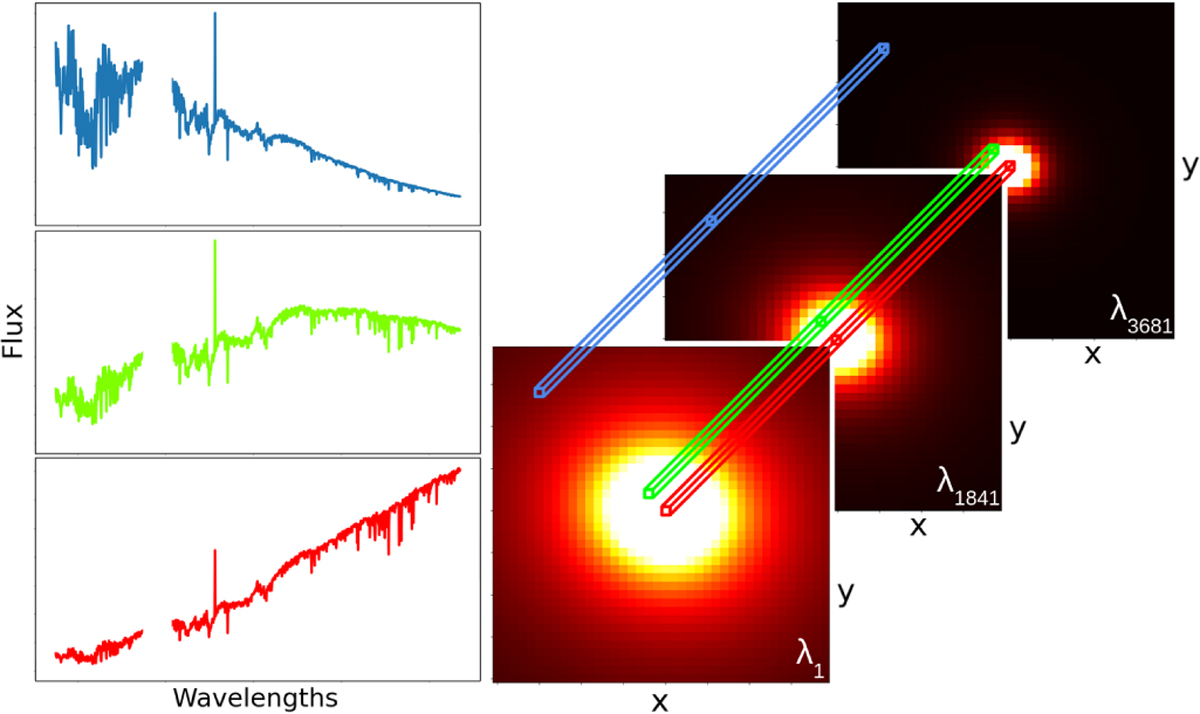
Spatio-spectral simulation of a star observation. On the right, three monochromatic images are shown at wavelengths λ1, λ1841, λ3681 to highlight the spatial spread variation with wavelength. On the left, three spaxels are shown at three different separations to highlight the spectrum deformation caused by this spatial spread variation.
Current usage metrics show cumulative count of Article Views (full-text article views including HTML views, PDF and ePub downloads, according to the available data) and Abstracts Views on Vision4Press platform.
Data correspond to usage on the plateform after 2015. The current usage metrics is available 48-96 hours after online publication and is updated daily on week days.
Initial download of the metrics may take a while.