Fig. F.1
Download original image
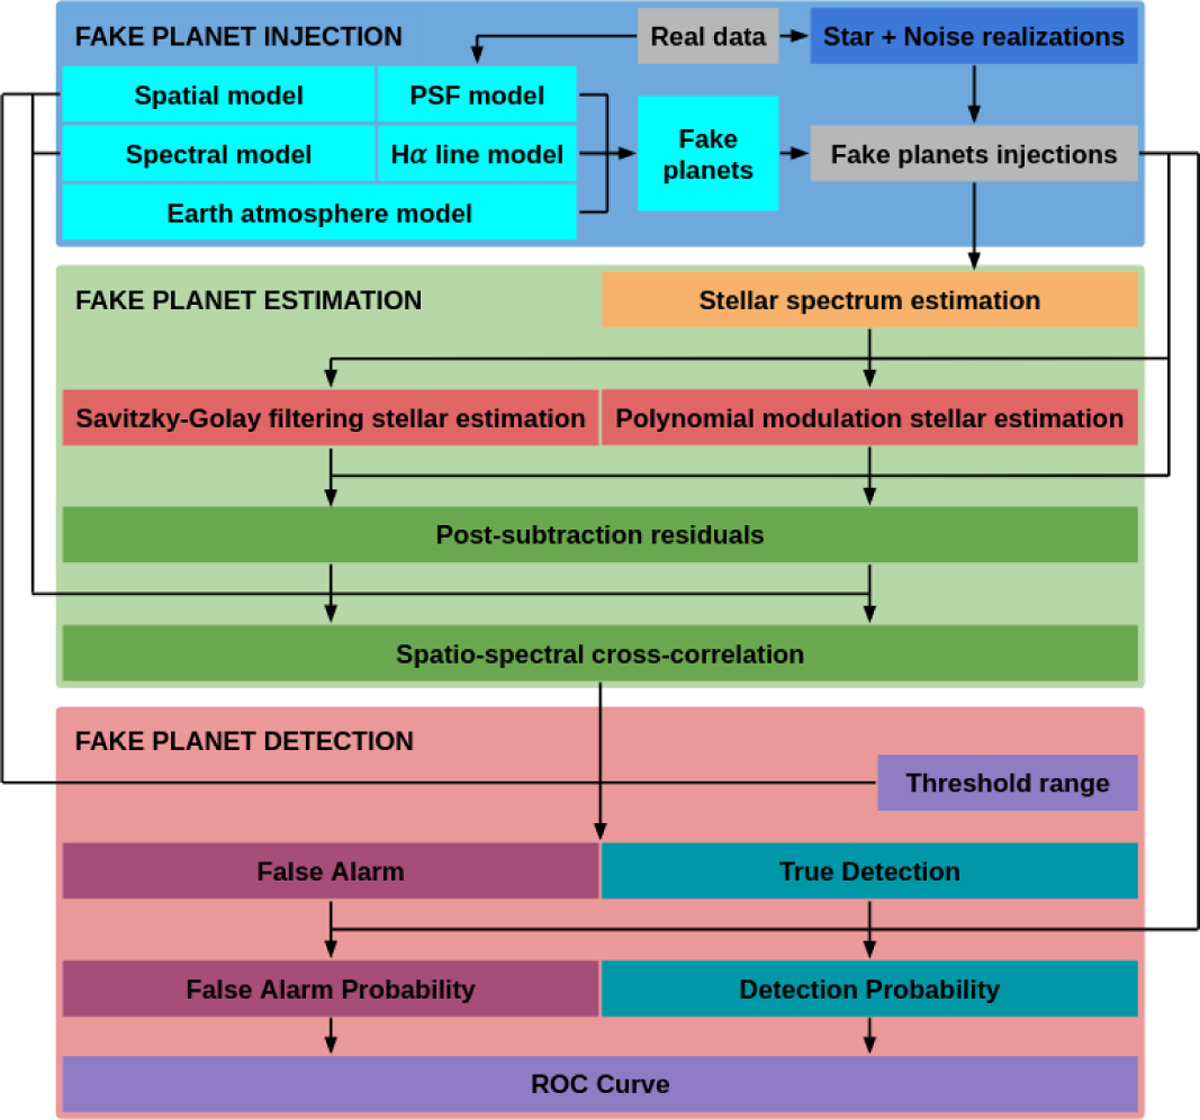
General ROC curve construction diagram. The first step is the injection of fake planets into real data cubes, at different separations and contrasts. The second step is the recovery of the planetary information from these data cubes using the two stellar halo subtraction methods. The third step is the determination of the probabilities of false alarm and detection following the variation of the planet detection validation threshold. The ROC curve depends directly on these last two variables.
Current usage metrics show cumulative count of Article Views (full-text article views including HTML views, PDF and ePub downloads, according to the available data) and Abstracts Views on Vision4Press platform.
Data correspond to usage on the plateform after 2015. The current usage metrics is available 48-96 hours after online publication and is updated daily on week days.
Initial download of the metrics may take a while.