Fig. G.1
Download original image
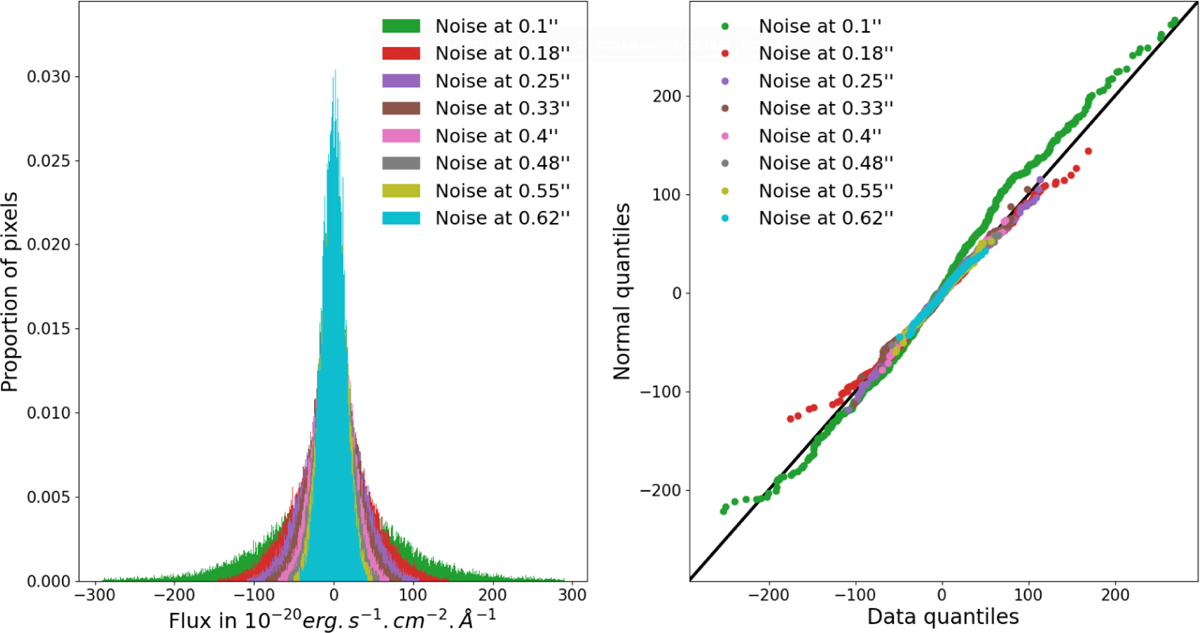
Normalized histograms and quantile-quantile plots of post-subtraction residual noise (from the 821 spectral channels of the median cube of the post-subtraction residuals of PDS70 images indicated in App. C, with our proposed method following the parameters indicated in Tab. 1). Each monochromatic image is separated into concentric rings (Andres 1994) grouped by 3 to distinguish distributions by separation at the center. Due to stellar residuals and possibly photon noise, the noise standard deviation is greater in the center, as shown in the figure on the left, and its distribution deviates from a Gaussian distribution, as shown in the figure on the right. On the contrary, as the separation increases, the standard deviation decreases and the distribution approaches a Gaussian distribution.
Current usage metrics show cumulative count of Article Views (full-text article views including HTML views, PDF and ePub downloads, according to the available data) and Abstracts Views on Vision4Press platform.
Data correspond to usage on the plateform after 2015. The current usage metrics is available 48-96 hours after online publication and is updated daily on week days.
Initial download of the metrics may take a while.