Open Access
Fig. 6
Download original image
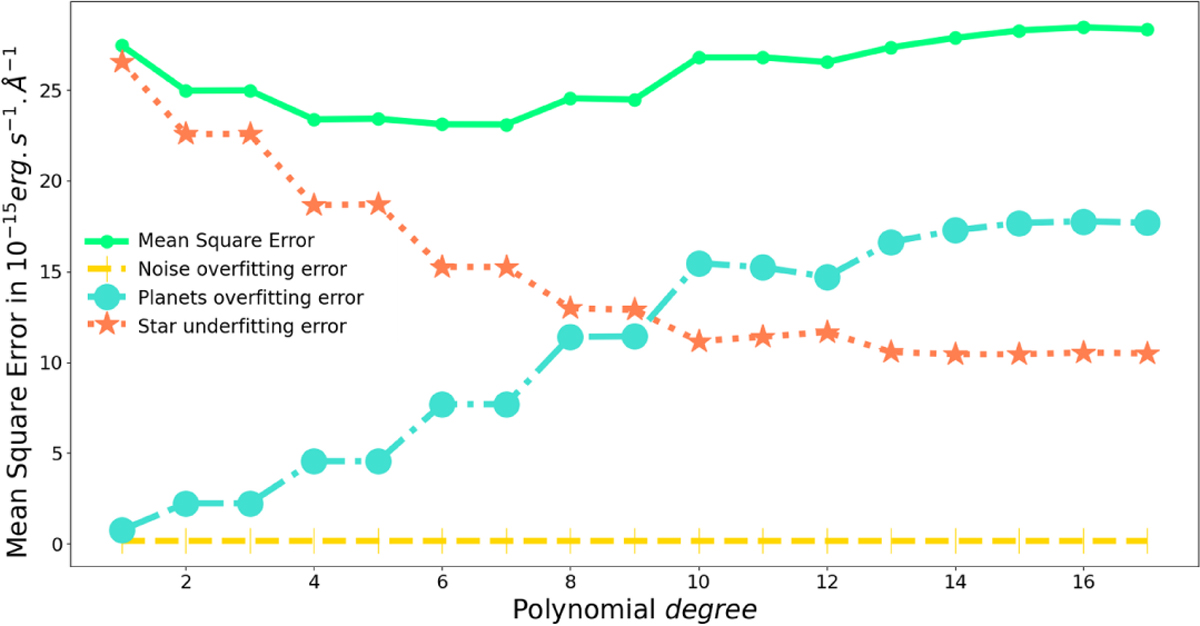
MSE decomposition at planet position at Hα line wavelength, following Eq. (B.5). The MSE (solid green line) is the sum of the noise overfitting error (dashed yellow line), planets overfitting error (dashdot-ted turquoise line), and star underfitting error (dotted orangy line).
Current usage metrics show cumulative count of Article Views (full-text article views including HTML views, PDF and ePub downloads, according to the available data) and Abstracts Views on Vision4Press platform.
Data correspond to usage on the plateform after 2015. The current usage metrics is available 48-96 hours after online publication and is updated daily on week days.
Initial download of the metrics may take a while.