Fig. 1.
Download original image
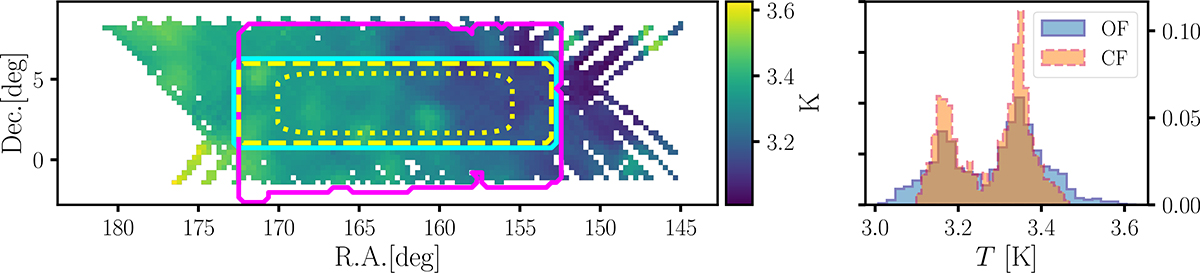
Left panel: Temperature sky map averaged along the frequency range considered, i.e. 971 < ν < 1023 MHz. We highlight the footprint of the WiggleZ galaxies in magenta, the smaller footprint CF where we perform the analysis of this work in cyan, and in yellow the Tukey window function we use for the power spectrum computations (dashed and dotted for the zero and 50% boundaries.). Right panel: Normalised histograms of the sky temperature of the data cubes for the original footprint (OF) in solid blue with respect to the cropped CF in dashed orange. The histograms are computed from the average map for each cube, to marginalise the frequency-dependent evolution of the temperature field. The double-peak structure reflects the galactic synchrotron gradient (low versus high RA) present in our sky patch, as shown in the left panel.
Current usage metrics show cumulative count of Article Views (full-text article views including HTML views, PDF and ePub downloads, according to the available data) and Abstracts Views on Vision4Press platform.
Data correspond to usage on the plateform after 2015. The current usage metrics is available 48-96 hours after online publication and is updated daily on week days.
Initial download of the metrics may take a while.