Fig. 12.
Download original image
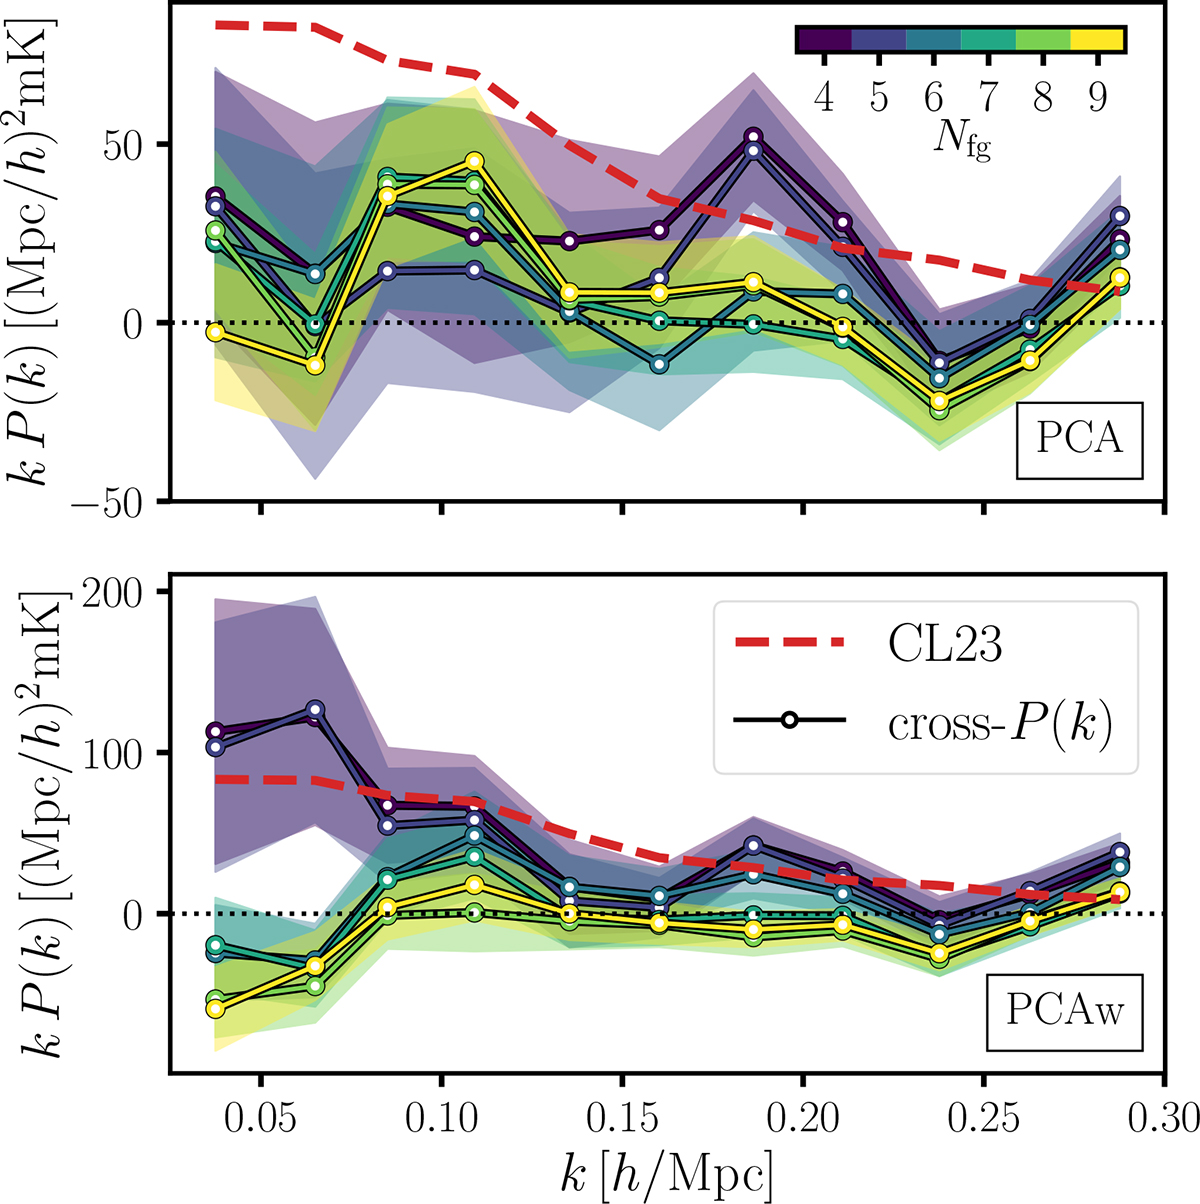
Cross-power spectra between WiggleZ galaxies and MeerKAT H I intensity maps at redshift z ≈ 0.4 for the PCA and PCAw cleaned cubes in the top and bottom panel, respectively. Maps are cleaned by removing different numbers of PCA (and PCAw) modes, from dark, Nfg = 4, to light colour lines, Nfg = 9; 1σ error bars are shown with the corresponding shaded areas. The red dashed line is the fitted model from CL23 (same data, different cleaning strategy) that instead includes a 𝒯-correction for the signal loss; as a rule-of-thumb, the uncorrected CL23 best-fit would show an 80% lower amplitude at the largest scale probed (e.g. below the 1σ boundary of the Nfg = 4 and 5 PCAw measurements for k ≲ 0.12 h/Mpc in the bottom panel). We plot the product kP(k) to accentuate the small scales that would otherwise be flattened by the much higher low-k measurements.
Current usage metrics show cumulative count of Article Views (full-text article views including HTML views, PDF and ePub downloads, according to the available data) and Abstracts Views on Vision4Press platform.
Data correspond to usage on the plateform after 2015. The current usage metrics is available 48-96 hours after online publication and is updated daily on week days.
Initial download of the metrics may take a while.