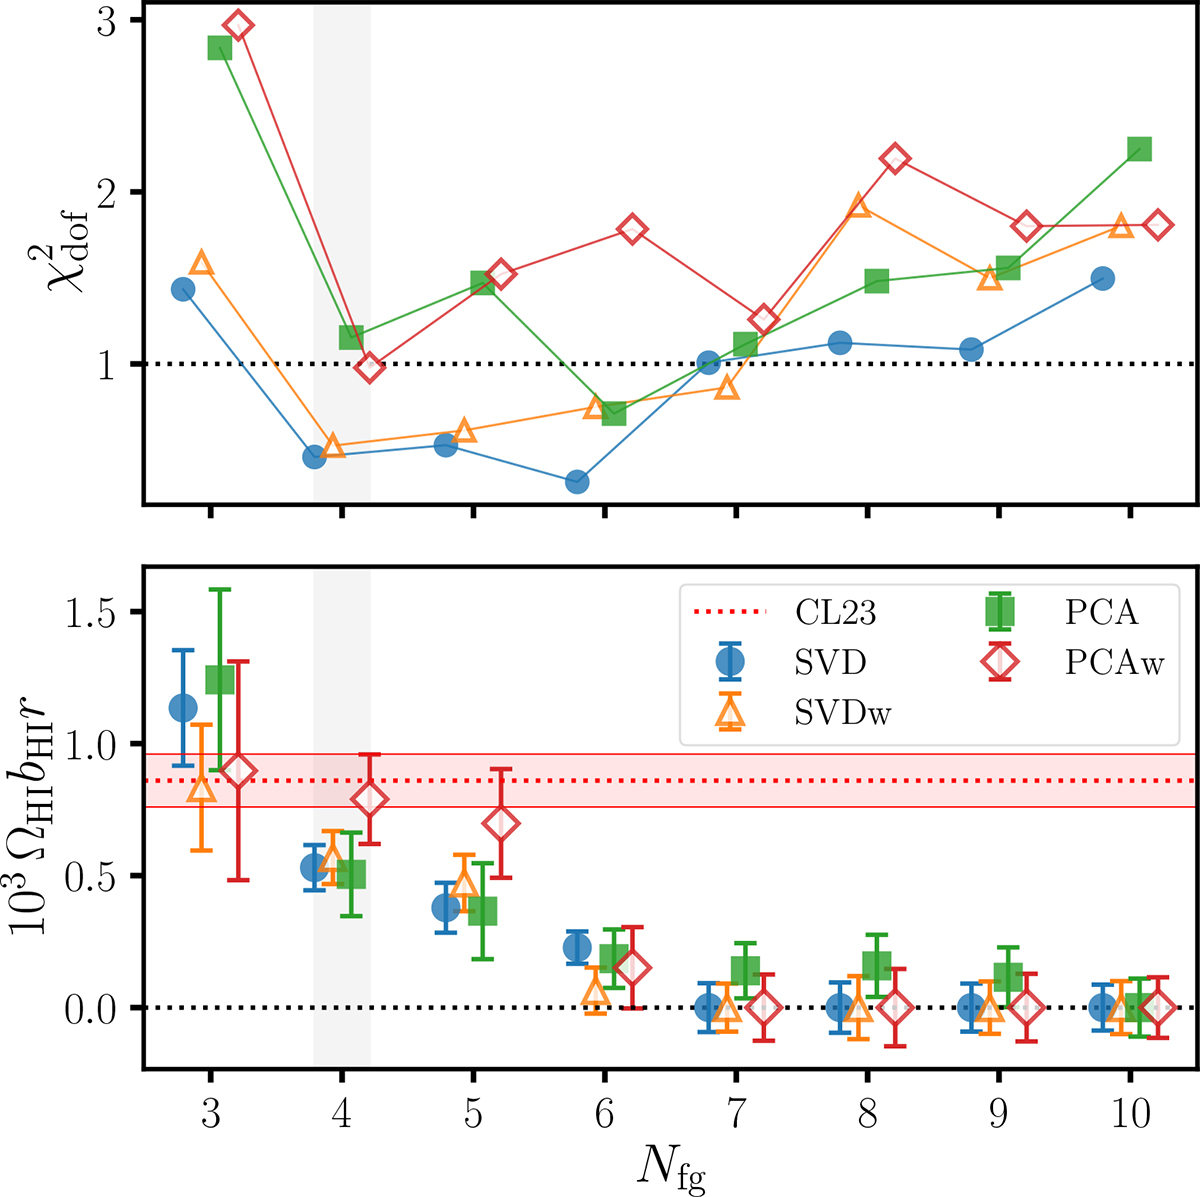
Fig. 14.
Download original image
Sensitivity of our results to the PCA-like contaminant subtractions as function of how many modes have been removed from the original cube. In the top panel, we show the reduced χ2 for each foreground cleaned cross-power spectra relative to its best-fitting model; in the bottom panel, the corresponding best-fitting ΩH I bH Ir values and their 1σ error bars. Filled symbols, circles and squares, are for an SVD a PCA cleaning respectively; their weighted counterparts corresponds to empty triangles and diamonds. In the bottom panel, the shaded red region highlights the CL23 best-fitting value and 1σ uncertainty that was obtained with a PCAw Nfg = 30 cleaning and a 𝒯-correction (the ‘uncorrected’ CL23 amplitude would lay between 0.2 − 0.3 × 10⁻³). We highlight in grey the Nfg = 4 results that correspond to our best and reference PCA result: the smallest Nfg to reach a plausible χ2.
Current usage metrics show cumulative count of Article Views (full-text article views including HTML views, PDF and ePub downloads, according to the available data) and Abstracts Views on Vision4Press platform.
Data correspond to usage on the plateform after 2015. The current usage metrics is available 48-96 hours after online publication and is updated daily on week days.
Initial download of the metrics may take a while.